Unlock a world of possibilities! Login now and discover the exclusive benefits awaiting you.
- Qlik Community
- :
- Forums
- :
- Analytics
- :
- New to Qlik Analytics
- :
- Help with Aggr
- Subscribe to RSS Feed
- Mark Topic as New
- Mark Topic as Read
- Float this Topic for Current User
- Bookmark
- Subscribe
- Mute
- Printer Friendly Page
- Mark as New
- Bookmark
- Subscribe
- Mute
- Subscribe to RSS Feed
- Permalink
- Report Inappropriate Content
Help with Aggr
I have searched on this topic and have not found a solution
I am trying to get an average of active employees by month and gender
My data looks like this
| ReportMonth | EmpID | Active Flag | New Hire Flag | Gender |
|---|---|---|---|---|
| 01/2018 | 1 | 1 | 0 | F |
| 01/2018 | 2 | 1 | 0 | F |
| 01/2018 | 3 | 0 | 1 | F |
| 01/2018 | 4 | 1 | 0 | M |
| 01/2018 | 5 | 0 | 1 | M |
| 02/2018 | 1 | 1 | 0 | F |
| 02/2018 | 2 | 0 | 0 | F |
| 02/2018 | 3 | 1 | 0 | F |
| 02/2018 | 4 | 0 | 0 | F |
| 02/2018 | 5 | 1 | 0 | M |
| 02/2018 | 6 | 0 | 1 | M |
| 02/2018 | 7 | 0 | 1 | M |
| 02/2018 | 8 | 0 | 1 | M |
What I am trying to do is get the average count of Active Flag + New Hire by month and gender.
I have this and this works by Month.
AVG(Aggr(count( {<ActiveFlag= {'1'}>} EmployeeID) + count( {< NewHireFlag= {'1'}>} EmployeeID), ReportMonth))
In my bar chart I have only gender as a dimension but it doesn't do the calculations right.
My expected result based on the data above would look like this.
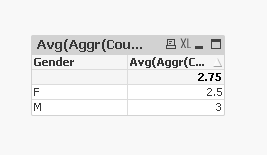
Average Female active employees for the both month = 2.5
Average Male active employees for both months = 3
Please help
Accepted Solutions
- Mark as New
- Bookmark
- Subscribe
- Mute
- Subscribe to RSS Feed
- Permalink
- Report Inappropriate Content
May be this
Avg(Aggr(Count({<[Active Flag]= {'1'}>+<[New Hire Flag] = {'1'}>} EmpID), ReportMonth, Gender))
- Mark as New
- Bookmark
- Subscribe
- Mute
- Subscribe to RSS Feed
- Permalink
- Report Inappropriate Content
May be this
Avg(Aggr(Count({<[Active Flag]= {'1'}>+<[New Hire Flag] = {'1'}>} EmpID), ReportMonth, Gender))
- Mark as New
- Bookmark
- Subscribe
- Mute
- Subscribe to RSS Feed
- Permalink
- Report Inappropriate Content
Thank you so much. It worked
- Mark as New
- Bookmark
- Subscribe
- Mute
- Subscribe to RSS Feed
- Permalink
- Report Inappropriate Content
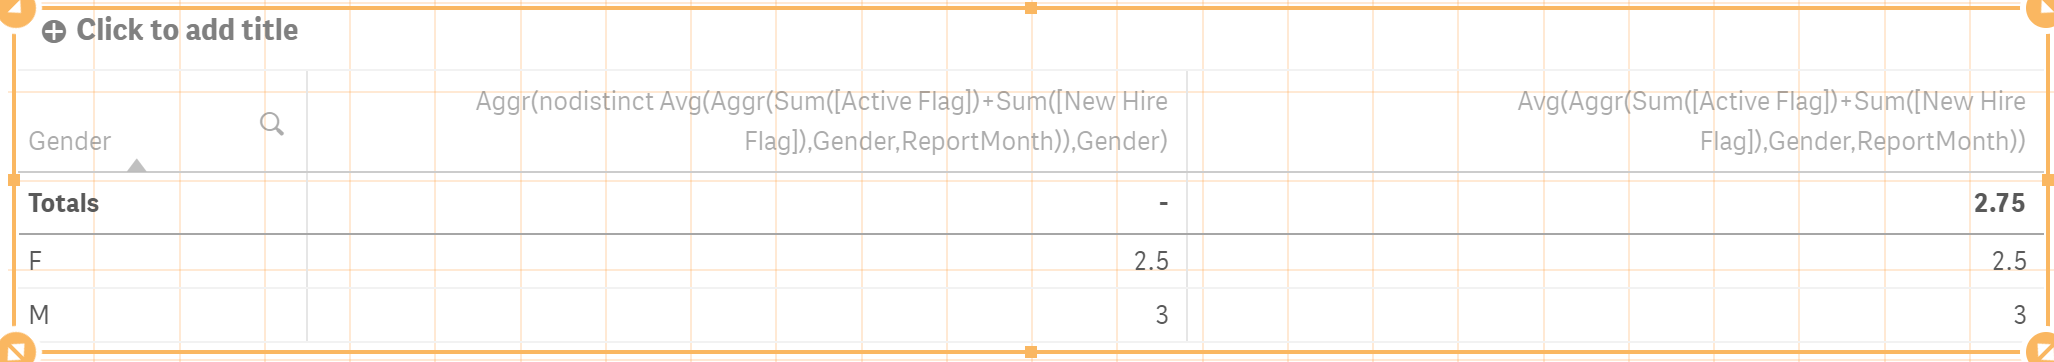
I came up with this -
Aggr(nodistinct Avg(Aggr(Sum([Active Flag])+Sum([New Hire Flag]),Gender,ReportMonth)),Gender)

- Mark as New
- Bookmark
- Subscribe
- Mute
- Subscribe to RSS Feed
- Permalink
- Report Inappropriate Content
Why an extra Aggr()?
- Mark as New
- Bookmark
- Subscribe
- Mute
- Subscribe to RSS Feed
- Permalink
- Report Inappropriate Content
When Chart dimension is Only Gender,then it wasn't working, showing '-'. Worked when surrounded by extra aggr.
- Mark as New
- Bookmark
- Subscribe
- Mute
- Subscribe to RSS Feed
- Permalink
- Report Inappropriate Content
Seems to be working for me in QlikView
Did you try in View or Sense?
- Mark as New
- Bookmark
- Subscribe
- Mute
- Subscribe to RSS Feed
- Permalink
- Report Inappropriate Content
My bad, may be I had something else when I saw '-' - both works in sense too -