Unlock a world of possibilities! Login now and discover the exclusive benefits awaiting you.
- Qlik Community
- :
- Forums
- :
- Analytics
- :
- New to Qlik Analytics
- :
- Hi guys I want to add the digital clock in texbox
- Subscribe to RSS Feed
- Mark Topic as New
- Mark Topic as Read
- Float this Topic for Current User
- Bookmark
- Subscribe
- Mute
- Printer Friendly Page
- Mark as New
- Bookmark
- Subscribe
- Mute
- Subscribe to RSS Feed
- Permalink
- Report Inappropriate Content
Hi guys I want to add the digital clock in texbox
Any one help me how to add the.
Kind Regards,
Abhishek Singh
Accepted Solutions
- Mark as New
- Bookmark
- Subscribe
- Mute
- Subscribe to RSS Feed
- Permalink
- Report Inappropriate Content
PFA
https://community.qlik.com/message/901096#901096
Vikas
If the issue is solved please mark the answer with Accept as Solution & like it.
If you want to go quickly, go alone. If you want to go far, go together.
- Mark as New
- Bookmark
- Subscribe
- Mute
- Subscribe to RSS Feed
- Permalink
- Report Inappropriate Content
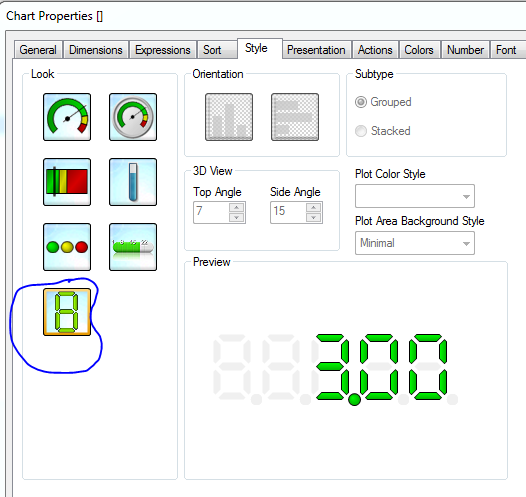
I think you are looking for a Gauge Chart. You can change it to digital clock view on the style tab of the chart propertise
- Mark as New
- Bookmark
- Subscribe
- Mute
- Subscribe to RSS Feed
- Permalink
- Report Inappropriate Content
I happy to see your reply.
But i'm not using chart I want to show in a simple text box.
- Mark as New
- Bookmark
- Subscribe
- Mute
- Subscribe to RSS Feed
- Permalink
- Report Inappropriate Content
Hi,
Use Gauge Chart and set the Last style (Number) in the Style tab.
Regards,
jagan.
- Mark as New
- Bookmark
- Subscribe
- Mute
- Subscribe to RSS Feed
- Permalink
- Report Inappropriate Content
FYI
Please find the attachment
I want to create this.
Thanks,
Abhishek
- Mark as New
- Bookmark
- Subscribe
- Mute
- Subscribe to RSS Feed
- Permalink
- Report Inappropriate Content
Hi,
I think you have to download and install similar font then only it is possible.
Regards,
jagan.
- Mark as New
- Bookmark
- Subscribe
- Mute
- Subscribe to RSS Feed
- Permalink
- Report Inappropriate Content
PFA
https://community.qlik.com/message/901096#901096
Vikas
If the issue is solved please mark the answer with Accept as Solution & like it.
If you want to go quickly, go alone. If you want to go far, go together.
- Mark as New
- Bookmark
- Subscribe
- Mute
- Subscribe to RSS Feed
- Permalink
- Report Inappropriate Content
As this is a Sense question I looked for something in the Sense tool box.
The current gauge chart doesn't support that styling. I checked Qlik Branch and no projects have been developed so far to support this functionality.
So looks like you would have to build your own extension to create this visualisation.
The KPI Object is the closest visualisation to your example.
- Mark as New
- Bookmark
- Subscribe
- Mute
- Subscribe to RSS Feed
- Permalink
- Report Inappropriate Content
Example of KPI object in sense in action

Colour can be set conditionally if required.
- Mark as New
- Bookmark
- Subscribe
- Mute
- Subscribe to RSS Feed
- Permalink
- Report Inappropriate Content
Hi Abhishek,
As Andy mentioned, the KPI object is the most closest you can have. I would prefer going with building an extension, and should not be difficult at all as there are many Jquery plugins which you can make use of here to build one.
Check this out:
Jon Combe | Code | HTML clocks using JavaScript and CSS rotation

Thanks,
Sangram