Unlock a world of possibilities! Login now and discover the exclusive benefits awaiting you.
- Qlik Community
- :
- Forums
- :
- Analytics
- :
- New to Qlik Analytics
- :
- Re: Hide label
- Subscribe to RSS Feed
- Mark Topic as New
- Mark Topic as Read
- Float this Topic for Current User
- Bookmark
- Subscribe
- Mute
- Printer Friendly Page
- Mark as New
- Bookmark
- Subscribe
- Mute
- Subscribe to RSS Feed
- Permalink
- Report Inappropriate Content
Hide label
Hi,
I have an issue with a chart showing labels from two different dimensions in Qlik Sense. At the bottom there are two levels of labels and I want to hide only one of them - the one at the buttom, see attachment.
Any ideas?
Thanks for your input!
/Sara
- Mark as New
- Bookmark
- Subscribe
- Mute
- Subscribe to RSS Feed
- Permalink
- Report Inappropriate Content
Hi Sara, if you don't get a better answer you can use a workaround:
Remove one of your two dimensions and use two expressions using set analysis, one for QlikView and another for Qlik Sense
- Mark as New
- Bookmark
- Subscribe
- Mute
- Subscribe to RSS Feed
- Permalink
- Report Inappropriate Content
Hi Sara - I am not sure about your data structure, but adding to what Ruben stated, I wanted to provide an example of how this would work with Set Analysis:
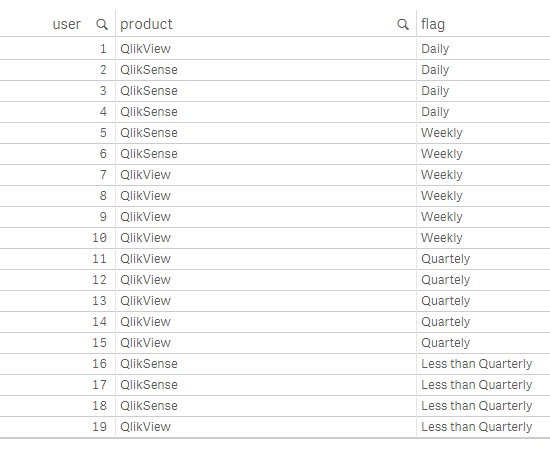
Here is some sample data (attached):

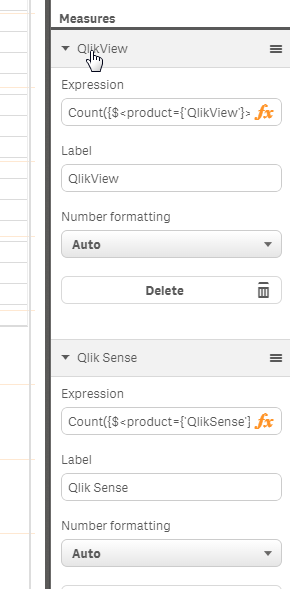
Here is what a Set Analysis statement would look like used in the measures:
Count({$<product={'QlikSense'}>}flag)
Count({$<product={'QlikView'}>}flag)

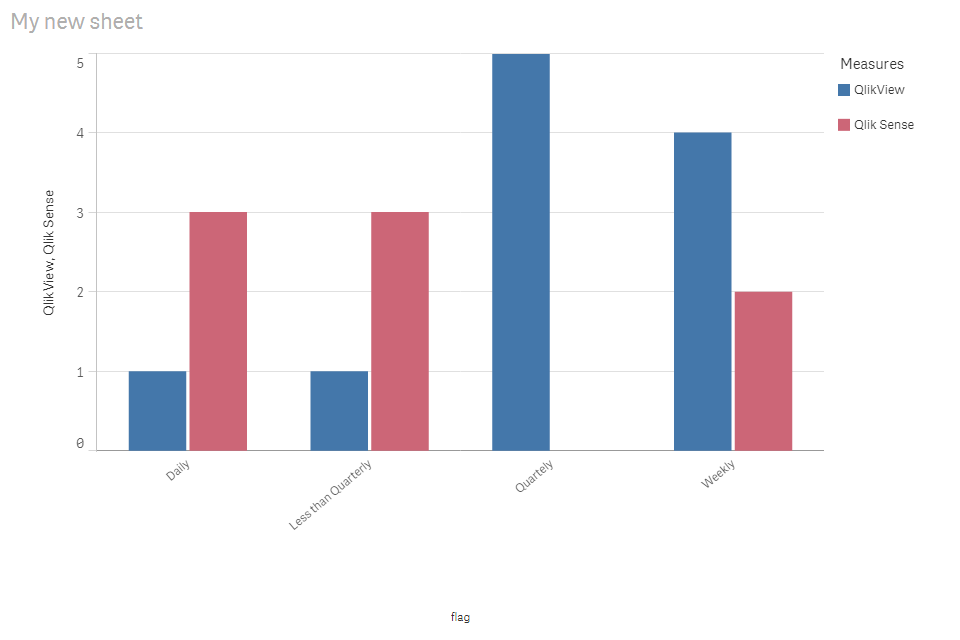
Output

If interested, you can learn more about Set Analysis here:A Beginners' Introduction to Set Analysis (video)
From this series: New to Qlik Sense Videos
I also attached a sample .qvf. Copy to your C:\Users\<user profile>\Documents\Qlik\Sense\Apps and refresh Qlik Sense Desktop using F5.
Please mark the appropriate replies as CORRECT / HELPFUL so our team and other members know that your question(s) has been answered to your satisfaction.
Regards,
Mike Tarallo
Qlik
Mike Tarallo
Qlik
- Mark as New
- Bookmark
- Subscribe
- Mute
- Subscribe to RSS Feed
- Permalink
- Report Inappropriate Content
Thank you very much! This solved my problem!
- Mark as New
- Bookmark
- Subscribe
- Mute
- Subscribe to RSS Feed
- Permalink
- Report Inappropriate Content
Thank you very much! This solved my problem! Thanks for the links as well, very informative!
- Mark as New
- Bookmark
- Subscribe
- Mute
- Subscribe to RSS Feed
- Permalink
- Report Inappropriate Content
HI Sara - great to hear. Let us know how else we can help you.
Please mark the appropriate replies as CORRECT and/or HELPFUL so our team and other members know that your question(s) has been answered to your satisfaction.
Regards,
Mike Tarallo
Qlik
Mike Tarallo
Qlik