Unlock a world of possibilities! Login now and discover the exclusive benefits awaiting you.
- Qlik Community
- :
- Forums
- :
- Analytics
- :
- New to Qlik Analytics
- :
- Highlight a pie chart by expression - with complic...
- Subscribe to RSS Feed
- Mark Topic as New
- Mark Topic as Read
- Float this Topic for Current User
- Bookmark
- Subscribe
- Mute
- Printer Friendly Page
- Mark as New
- Bookmark
- Subscribe
- Mute
- Subscribe to RSS Feed
- Permalink
- Report Inappropriate Content
Highlight a pie chart by expression - with complications
Hi all!
I'm creating a comparison of each client answer vs all answers.
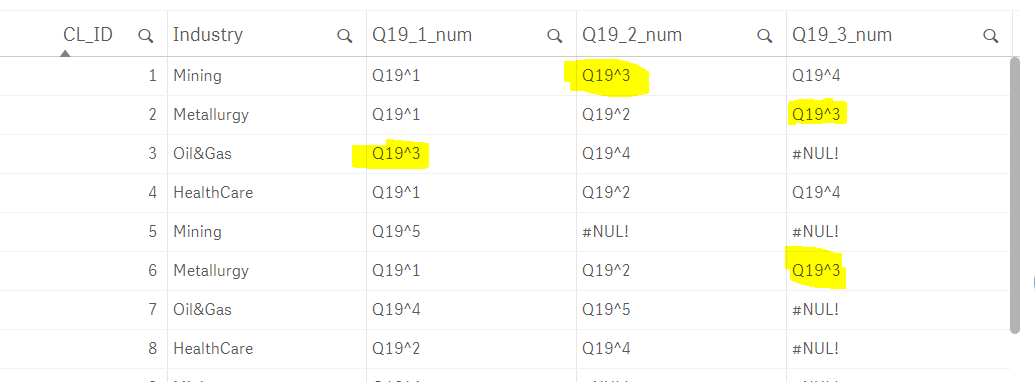
I have a client answer data below:
multiple answers to the question are possible and they are given in several (6, here shown 3) columns.:
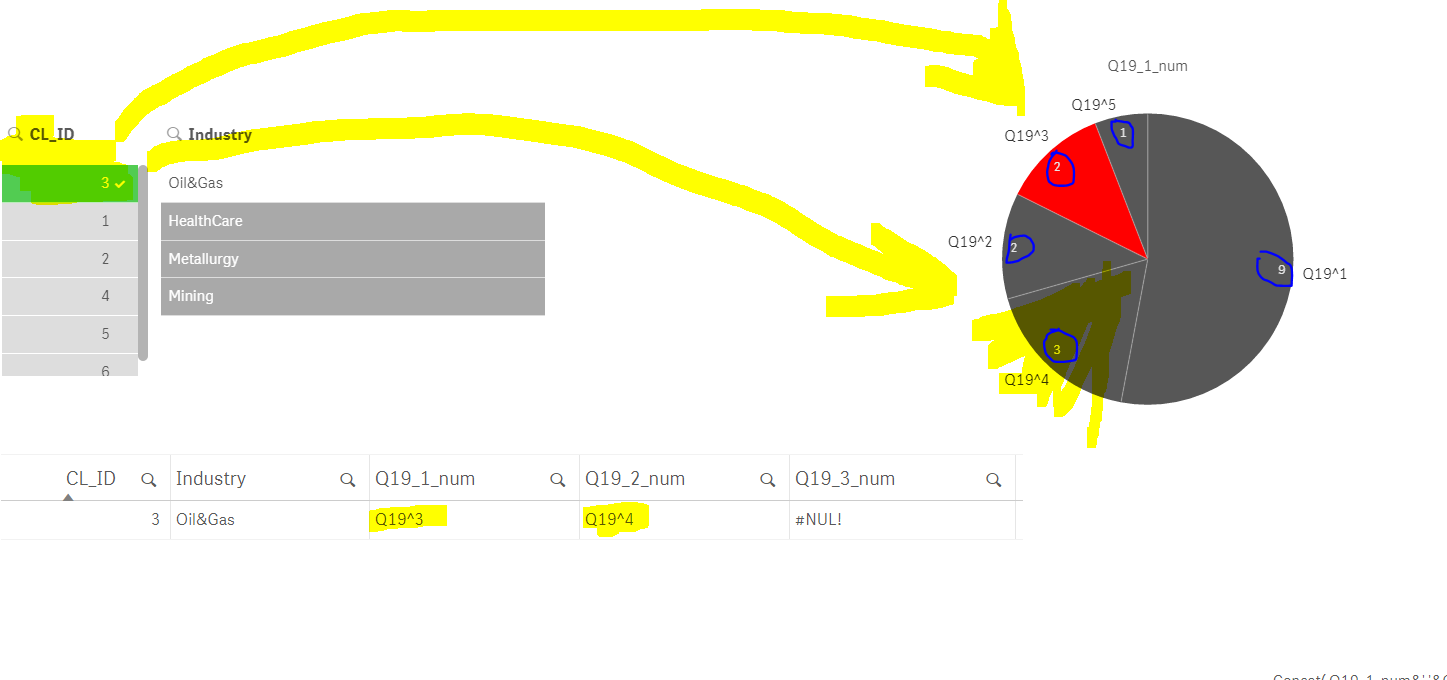
When I select one CL_ID, I need to see the pie chart with:
1. all answers of that CL_ID highlighted (now I see only first column highlighted),
2. on pie chart I need to see total numbers (count) of each answer (now I see only totals from first field only)
So, the data is in 6 columns, and I need to show
1) all of it in 1 pie chart
2) with ability to show count for answers from all 6 columns
3) and highlight the regions which are presented in chosen CL_ID row (when 1 CL_ID is selected).
File with example is attached...
Can you help me, please? 
- Mark as New
- Bookmark
- Subscribe
- Mute
- Subscribe to RSS Feed
- Permalink
- Report Inappropriate Content
Check the attached maybe
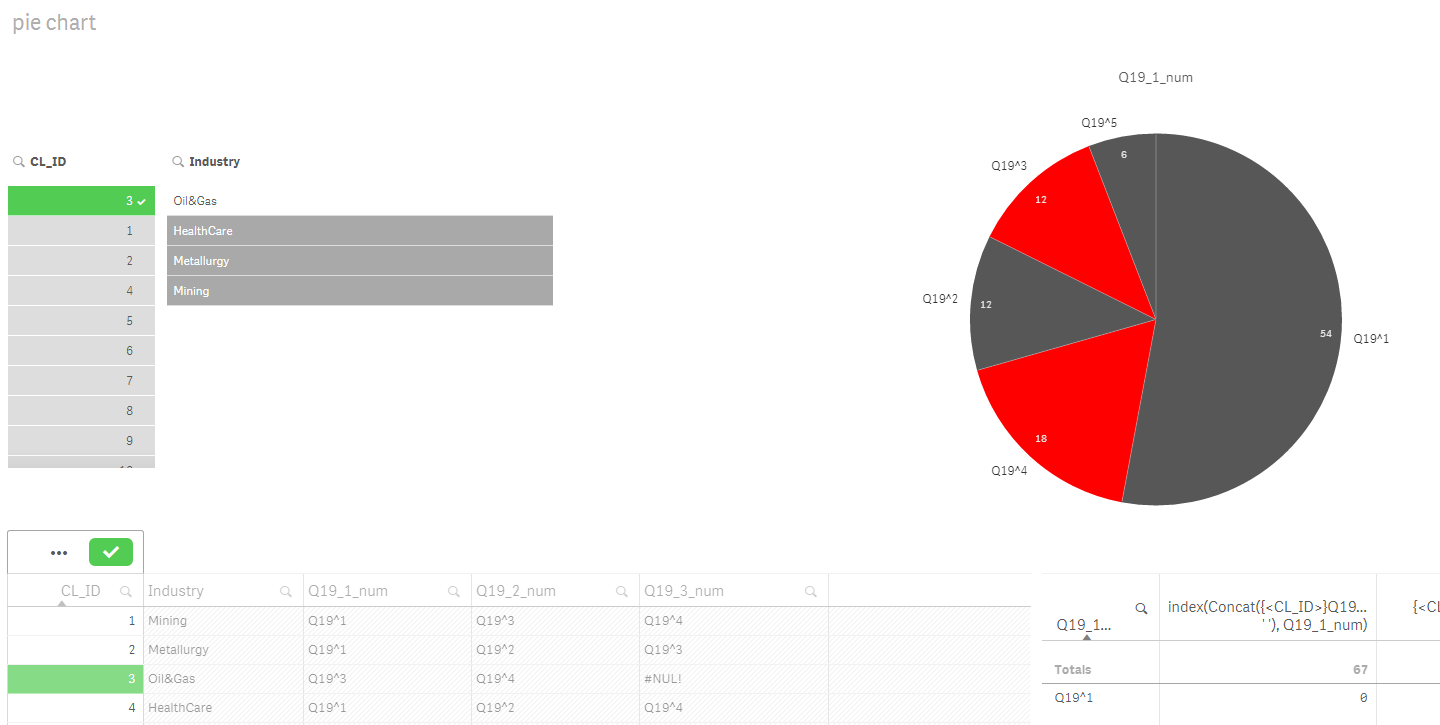
Color Expression:
If(Len(GetCurrentSelections())>0
and (index(Concat(DISTINCT {<CL_ID>}Q19_1_num, ' '), Only(TOTAL Q19_1_num)) >=1 or
index(Concat(DISTINCT {<CL_ID>}Q19_1_num, ' '), Only(TOTAL Q19_2_num)) >=1 or
index(Concat(DISTINCT {<CL_ID>}Q19_1_num, ' '), Only(TOTAL Q19_3_num)) >=1 or
index(Concat(DISTINCT {<CL_ID>}Q19_1_num, ' '), Only(TOTAL Q19_4_num)) >=1 or
index(Concat(DISTINCT {<CL_ID>}Q19_1_num, ' '), Only(TOTAL Q19_5_num)) >=1 or
index(Concat(DISTINCT {<CL_ID>}Q19_1_num, ' '), Only(TOTAL Q19_6_num)) >=1
)
, rgb(255, 0, 0), rgb(87, 87, 87))
Measure
RangeSum(
Count({<CL_ID=>}Q19_1_num),
Count({<CL_ID=>}Q19_2_num),
Count({<CL_ID=>}Q19_3_num),
Count({<CL_ID=>}Q19_4_num),
Count({<CL_ID=>}Q19_5_num),
Count({<CL_ID=>}Q19_6_num))
- Mark as New
- Bookmark
- Subscribe
- Mute
- Subscribe to RSS Feed
- Permalink
- Report Inappropriate Content
Yes, you highlight it correctly.
But the total numbers (measure count) of each answer (Q19^1, Q19^2 etc) on pie chart are incorrect.
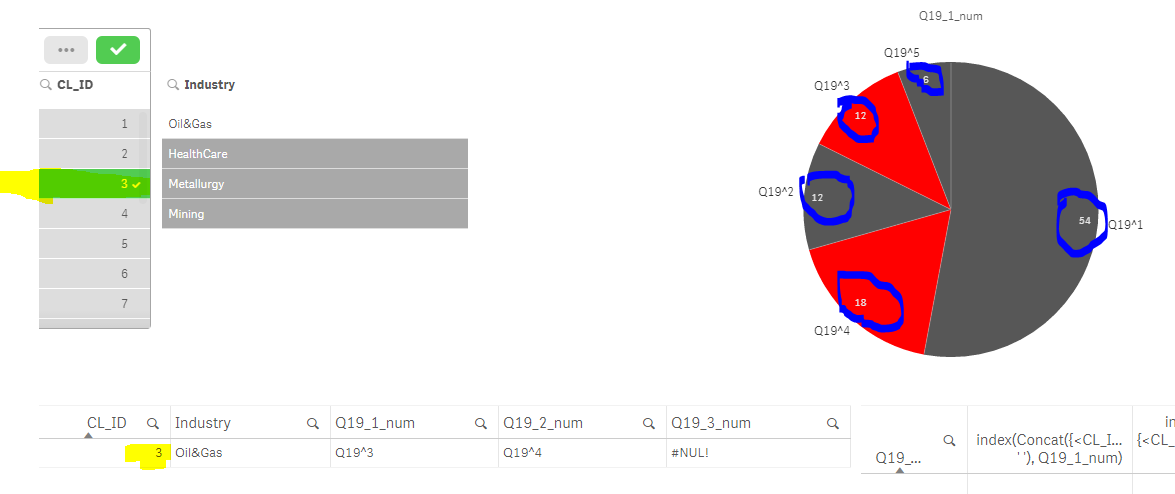
The data used in example has only:
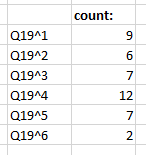
and on the pie chart we see 54 of Q19^1, but actually it should be 9
So please make it count totals right...
- Mark as New
- Bookmark
- Subscribe
- Mute
- Subscribe to RSS Feed
- Permalink
- Report Inappropriate Content
The way it is currently structured, I don't think this would be possible.... May be use a new island dimension to do this....
- Mark as New
- Bookmark
- Subscribe
- Mute
- Subscribe to RSS Feed
- Permalink
- Report Inappropriate Content
What I cannot do is to alter the huge table with answers (inputs) - loaded inline in this example.
If you know how to make it work with new dimension using script - be so kind to show it....