Unlock a world of possibilities! Login now and discover the exclusive benefits awaiting you.
- Qlik Community
- :
- Forums
- :
- Analytics
- :
- New to Qlik Analytics
- :
- Horizontal Dimension over Expression
- Subscribe to RSS Feed
- Mark Topic as New
- Mark Topic as Read
- Float this Topic for Current User
- Bookmark
- Subscribe
- Mute
- Printer Friendly Page
- Mark as New
- Bookmark
- Subscribe
- Mute
- Subscribe to RSS Feed
- Permalink
- Report Inappropriate Content
Horizontal Dimension over Expression
Hello everyone!
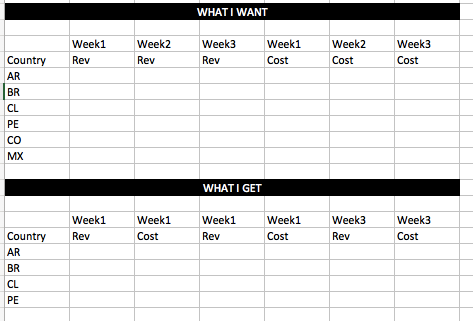
1-Im trying to get this table? is it possible?
I can move the Week Dimension to be horizontal, but I cant put it over expressions. The main idea is to group the evolution of one expression over weeks, in order to quickly look its evolution. With one metric the table get as I want, but when I add more than one this happens and is hard to visually see the evolution of one metric as you need to skip columns to see the performance.

2-Do you know how can I get an expression made from the a math results with only values from the same raw. Example Cost Evolution Week2 over Week 1. So in the same table I can have the raw data and the % variation.
Thanks
- Tags:
- dimension
- expressions
- Mark as New
- Bookmark
- Subscribe
- Mute
- Subscribe to RSS Feed
- Permalink
- Report Inappropriate Content
Hi Lucas,
Could you share with us an example qvf?
Thank you!
G.
- Mark as New
- Bookmark
- Subscribe
- Mute
- Subscribe to RSS Feed
- Permalink
- Report Inappropriate Content
Add your Week dimension using the Properties pane of the pivot table. Choose Add Data and then choose Column instead of Row.
talk is cheap, supply exceeds demand