Unlock a world of possibilities! Login now and discover the exclusive benefits awaiting you.
- Qlik Community
- :
- Forums
- :
- Analytics
- :
- New to Qlik Analytics
- :
- How can I have a bar chart that displays 1 measure...
- Subscribe to RSS Feed
- Mark Topic as New
- Mark Topic as Read
- Float this Topic for Current User
- Bookmark
- Subscribe
- Mute
- Printer Friendly Page
- Mark as New
- Bookmark
- Subscribe
- Mute
- Subscribe to RSS Feed
- Permalink
- Report Inappropriate Content
How can I have a bar chart that displays 1 measure but is limited by another
Hello,
I need to create the following;
Dimension (displayed) - country
Measure (displayed) - number of days
Measure (hidden) - number of sales
The number of sales measure should not be shown but the chart needs to only pick up the top 4 countries by number of sales and display the number of days for those countries. Right now I can only select the top 4 by number of days.
Please can you help.
Thanks,
Kizzy
- « Previous Replies
-
- 1
- 2
- Next Replies »
- Mark as New
- Bookmark
- Subscribe
- Mute
- Subscribe to RSS Feed
- Permalink
- Report Inappropriate Content
Hi try this
Take a Barchart take a Dimension-Country
Expression -sum(Days)
In sorting for Country select ''Sort by Expression '' and write sum(sales) in expression and select Ascending order
- Mark as New
- Bookmark
- Subscribe
- Mute
- Subscribe to RSS Feed
- Permalink
- Report Inappropriate Content
You don't need to add another measure, just add the condition to show top 4 in the set analysis of the expression for number of days
For example
Dimension (displayed) - country
Measure (displayed) - number of days
=Count({<Country = {"=RANK(Sum(Sales))<=4"}>}Days)
If a post helps to resolve your issue, please accept it as a Solution.
- Mark as New
- Bookmark
- Subscribe
- Mute
- Subscribe to RSS Feed
- Permalink
- Report Inappropriate Content
Hi Thirumal,
Thanks for the response but it is still only showing Days.
Please see below the actual expressions (I used days and Sales as a simple example).
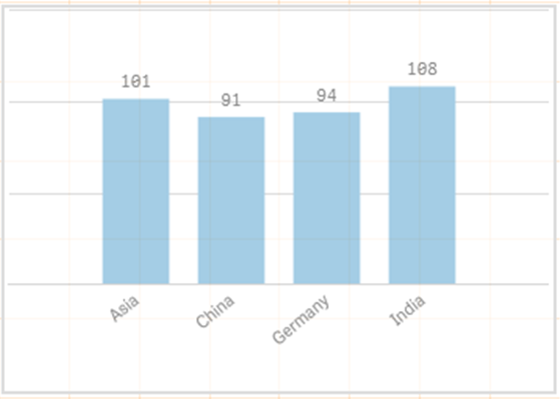
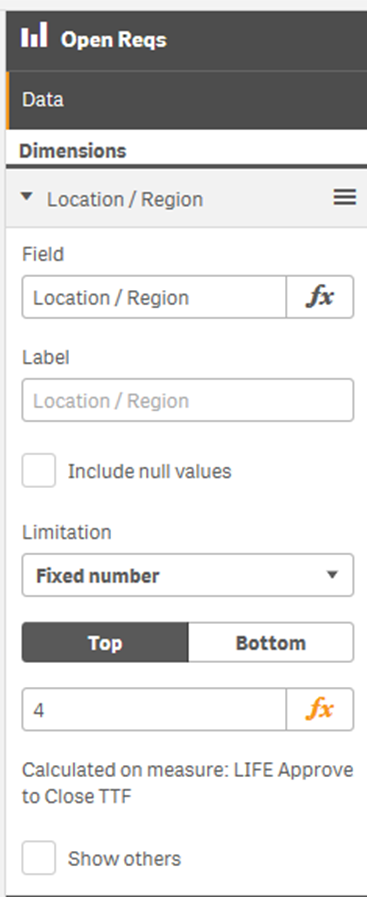
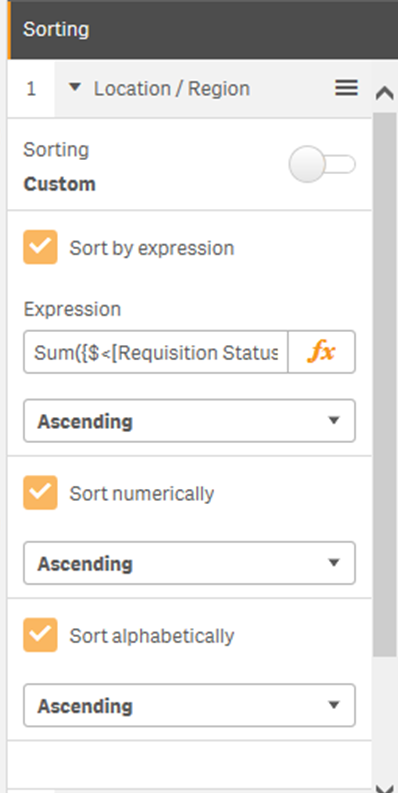
The Dimension - Location/Region has been limited to only show the top 4 but this is picking up Measure 1 and I need it to pick up Measure 2. I have inlcuded a screen shot of the sort as per your instructions.
Please can you see what I've done wrong.
Thanks,
Kizzy
- Mark as New
- Bookmark
- Subscribe
- Mute
- Subscribe to RSS Feed
- Permalink
- Report Inappropriate Content
Hi Vineeth,
The current expressions are
Measure 1 -
Sum({$<[Requisition Status]={Closed},[Division]={'Lifestyle Audio'}>}[Approve to Close])/Sum({$<[Requisition Status]={Closed},[Division]={'Lifestyle Audio'}>}[Number of Filled Reqs])
Measure 2 -
Sum({$<[Requisition Status]={Closed},[Division]={'Lifestyle Audio'}>}[Number of Filled Reqs])
Please advise how I would recreate with the actual expressions. Also I have several other bar charts that need the same type of filter in which the first measure is different, do i need to create an expression for each chart to get the top 4?
Thanks,
Kizzy
- Mark as New
- Bookmark
- Subscribe
- Mute
- Subscribe to RSS Feed
- Permalink
- Report Inappropriate Content
few questions:
what is measure 1 for ?
what is measure 2 for ?
which one of these do you want to show in the chart?
how do you want to limit the dimensions by ? top 4 by measure 1 or top by measure 2 ?
If a post helps to resolve your issue, please accept it as a Solution.
- Mark as New
- Bookmark
- Subscribe
- Mute
- Subscribe to RSS Feed
- Permalink
- Report Inappropriate Content
or you can also add a calculated dimension instead
replace existing dimension with
=AGGR(
if( RANK ( SUM (Sales) )<= 4 , Country)
, Country )
and then check suppress null values
If a post helps to resolve your issue, please accept it as a Solution.
- Mark as New
- Bookmark
- Subscribe
- Mute
- Subscribe to RSS Feed
- Permalink
- Report Inappropriate Content
Hi Vineeth,
Measure 1 - shows the Time to Fill calculation (including filters) - Sum of 1 field divided by the sun of another field - This should be the figure that is displayed in the bar chart
Measure 2 - shows the total number of hires (including filters)
I want the bar chart to pick the top 4 total number of hires (measure 2) but to display the Time to Fill (measure 1) in the actual chart. The second measure should not show anywhere on the actual chart it is for filtering only.
Hope this makes sense.
Thanks,
Kizzy
- Mark as New
- Bookmark
- Subscribe
- Mute
- Subscribe to RSS Feed
- Permalink
- Report Inappropriate Content
ok,try below and remove Measure 2
=if( RANK( Sum({$<[Requisition Status]={Closed},[Division]={'Lifestyle Audio'}>}[Number of Filled Reqs]) )<=4,
Sum({$<[Requisition Status]={Closed},[Division]={'Lifestyle Audio'}>}[Approve to Close])
/Sum({$<[Requisition Status]={Closed},[Division]={'Lifestyle Audio'}>}
[Number of Filled Reqs])
)
If a post helps to resolve your issue, please accept it as a Solution.
- Mark as New
- Bookmark
- Subscribe
- Mute
- Subscribe to RSS Feed
- Permalink
- Report Inappropriate Content
Hi Vineeth,
This works - thanks so much for your help!
Kizzy
- « Previous Replies
-
- 1
- 2
- Next Replies »