Unlock a world of possibilities! Login now and discover the exclusive benefits awaiting you.
- Qlik Community
- :
- Forums
- :
- Analytics
- :
- New to Qlik Analytics
- :
- How can I reference the values from Dimensions in ...
- Subscribe to RSS Feed
- Mark Topic as New
- Mark Topic as Read
- Float this Topic for Current User
- Bookmark
- Subscribe
- Mute
- Printer Friendly Page
- Mark as New
- Bookmark
- Subscribe
- Mute
- Subscribe to RSS Feed
- Permalink
- Report Inappropriate Content
How can I reference the values from Dimensions in set analysis?
Hi all,
I was hoping to tap into your knowledge for help with this issue I'm having.
What I'm trying to do is with set analysis measure the decline in user activity, using a log of transactions.
The logic is that any user that completed a transaction last month and hasn't done any this month should be counted against the month they're missing from.
To help, I've created a field called "LapseTransactionMonth". This field is the transaction created month forward-dated by 1 month.
So, the basic code would be:
//All users with transactions in the previous month
Count({<LapseTransactionMonth = {"=CurrentMonth"}>} Distinct UserID) -
//Subtract subset of users with transactions this month
Count({<LapseTransactionMonth = {"=CurrentMonth"}, TransactionMonth = {"=(CurrentMonth)"} >} Distinct UserID)
Note, CurrentMonth is meant to signify the month dimension on the visualisation; so if there are 7 months worth of data, this formula should be applied to each of them.
Sofar, I've not been able to crack this.
Thank you for your help.
Sven
- « Previous Replies
-
- 1
- 2
- Next Replies »
- Mark as New
- Bookmark
- Subscribe
- Mute
- Subscribe to RSS Feed
- Permalink
- Report Inappropriate Content
Hi Vineeth,
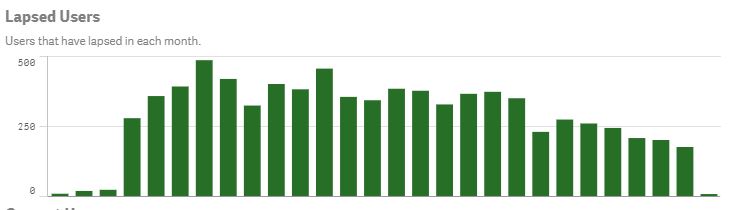
I think you're solution comes closest, but the problem I'm having is that I need the formula to work on a chart and apply the logic to each month, meaning the check for previous transactions has to happen for every month's worth of data I have, not just the latest (see below mock-up, each bar is showing how many users stopped transacting in that month).
This is also further complicated by filters available in the app as a whole, which can make the calculation show misleading data, e.g. when multiple months are selected.
None of the solutions I think of work the way I need them, so I've put a pin in it until a Qlik representative is coming to my office, next week. If they can't help, I'll have to accept this as a limitation of Qlik Sense.
But if the representative has any ideas, I'll share them with you here.
Thanks for all your effort with this,
Sven
- Mark as New
- Bookmark
- Subscribe
- Mute
- Subscribe to RSS Feed
- Permalink
- Report Inappropriate Content
Hi Sven,
"check for previous transactions has to happen for every month's worth of data I have, not just the latest "
Can you post sample data/example and a data table that shows what the figures should be, I like to keep trying. 
Cheers
V
If a post helps to resolve your issue, please accept it as a Solution.
- « Previous Replies
-
- 1
- 2
- Next Replies »