Unlock a world of possibilities! Login now and discover the exclusive benefits awaiting you.
- Qlik Community
- :
- Forums
- :
- Analytics
- :
- New to Qlik Analytics
- :
- How to add another expression as text on a bar-cha...
- Subscribe to RSS Feed
- Mark Topic as New
- Mark Topic as Read
- Float this Topic for Current User
- Bookmark
- Subscribe
- Mute
- Printer Friendly Page
- Mark as New
- Bookmark
- Subscribe
- Mute
- Subscribe to RSS Feed
- Permalink
- Report Inappropriate Content
How to add another expression as text on a bar-chart?
Hello,
In QV, I used to add some information as text on bar charts.
Eg:
Is there a way to do the same thing with QlikSense?
I only succeed to display the value of the bar, not another expression (even if I use a "dual" expression).
Thank you.
Accepted Solutions
- Mark as New
- Bookmark
- Subscribe
- Mute
- Subscribe to RSS Feed
- Permalink
- Report Inappropriate Content
Hi Nicolas,
Sorry I misunderstood your original post. Currently what you are describing is not a feature of Qlik Sense. We are working to continuously improve Qlik Sense (there will be 3 feature releases every year). You also may want to check out Qlik Branch to see if anyone has created an extension with this functionality.
-Josh
Qlik
- Mark as New
- Bookmark
- Subscribe
- Mute
- Subscribe to RSS Feed
- Permalink
- Report Inappropriate Content
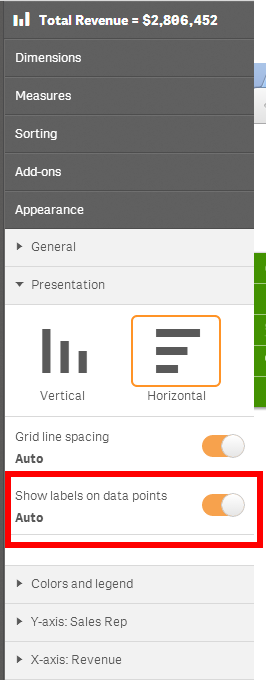
Hi Nicolas,
Take a look under Appearance->Presentation for "Show labels on data points". One thing to note is Qlik Sense uses responsive design so if you do not have enough space to show the labels, they will be automatically remove to avoid clutter. When you expand the chart or use a larger screen the labels will automatically appear.
-Josh
Qlik
- Mark as New
- Bookmark
- Subscribe
- Mute
- Subscribe to RSS Feed
- Permalink
- Report Inappropriate Content
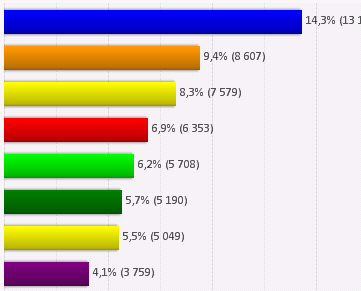
The option "Show labels on data points" will display the value used to define the bar width.
I would like to display something else.
In my snapshot, the values are "14.3%", "9.4%", "8.3%", ... But instead of showing only this value, I want to show "14.3 (based on 13 157 values)", 9.4% (based on8 607 values)", ...
In QlikView, I use
dual([expression to be displayed on data point], [expression to define the bar width])
but it doesn't work on QlikSense.
- Mark as New
- Bookmark
- Subscribe
- Mute
- Subscribe to RSS Feed
- Permalink
- Report Inappropriate Content
Hi Nicolas,
Sorry I misunderstood your original post. Currently what you are describing is not a feature of Qlik Sense. We are working to continuously improve Qlik Sense (there will be 3 feature releases every year). You also may want to check out Qlik Branch to see if anyone has created an extension with this functionality.
-Josh
Qlik
- Mark as New
- Bookmark
- Subscribe
- Mute
- Subscribe to RSS Feed
- Permalink
- Report Inappropriate Content
Hi,
I have the same requirement now in my project. I need to add another expression as text on a bar chart. Any new feature is added in Qlik sense or any extension is available ?
Thanks in advance.