Unlock a world of possibilities! Login now and discover the exclusive benefits awaiting you.
- Qlik Community
- :
- Forums
- :
- Analytics
- :
- New to Qlik Analytics
- :
- Re: Dimension for Top 20 Suppliers by Spend and pe...
- Subscribe to RSS Feed
- Mark Topic as New
- Mark Topic as Read
- Float this Topic for Current User
- Bookmark
- Subscribe
- Mute
- Printer Friendly Page
- Mark as New
- Bookmark
- Subscribe
- Mute
- Subscribe to RSS Feed
- Permalink
- Report Inappropriate Content
How to calculate Dimension for Top 20 Suppliers by Spend and per Year in Qlik Sense?
Hi Everyone,
I am trying to create a dimension that calculates the spending of the top 20 suppliers by spend and per year.
My current formula is the following:
=sum({<[Supplier ] = {"=Aggr(Rank(Sum([Spend]))<=20, [Supplier]) "}>} [Spend])I have data between 2019 to 2022 YTD. I use this dimension in a bar chart in which the X-axis shows the Years.
When I select one year, the dimension is calculating the correct figure. However, if I don't select any year, the formula is currently checking the top 20 suppliers for all years and then it checks the spending of these suppliers in each year.
I need that the total spend per year is the same regardless if I select one year or not.
Thanks in advance for your support!
- Tags:
- aggr
- « Previous Replies
-
- 1
- 2
- Next Replies »
Accepted Solutions
- Mark as New
- Bookmark
- Subscribe
- Mute
- Subscribe to RSS Feed
- Permalink
- Report Inappropriate Content
Hi @Goncalo
The expression I gave the first time out required that the Supplier was one of the dimensions, without that you will need to add it into the aggr.
So, the expression is now:
=sum(aggr(if(rank(sum(Spend)) <= 20, sum(Spend), null()), Year, Supplier))This screengrab shows it working, with the 2020 value being the same regardless of selection.
Test data generated with:
Random:
LOAD
    chr(65 + floor(rand()*4)) & chr(65 + floor(rand()*26)) as Supplier,
    2019 + floor(rand()*4) as Year,
    ceil(rand()*1000) as Spend
AUTOGENERATE(500)
;
The whole app is attached should you want to take a look.
Hope that helps.
Steve
- Mark as New
- Bookmark
- Subscribe
- Mute
- Subscribe to RSS Feed
- Permalink
- Report Inappropriate Content
Hi @Goncalo
I think the way you approach it for months would have to be different, as you are working out the top 20 at a different level of dimensionality from what the chart is at.
I think that this code should do it:
=if(GetPossibleCount(Year) > 1,
sum(aggr(if(rank(sum(Spend)) <= 20, sum(Spend), null()), Year, Supplier)),
sum({<Supplier={'$(=concat(TOTAL aggr(if(rank(sum(Spend)) <= 20, Supplier, null()), Supplier), chr(39) & ',' & chr(39)))'}>} Spend))
You will recognize the old expression in there (in italics), the other expression gets the list of suppliers outside of the expression and then injects it in using Set Analysis.
The loaded script to test this one is:
Random:
LOAD
*,
Year(Month) as Year
;
LOAD
chr(65 + floor(rand()*4)) & chr(65 + floor(rand()*26)) as Supplier,
Date(AddMonths(makedate(2019,1), floor(rand()*48)), 'MMM-YYYY') as Month,
ceil(rand()*1000) as Spend
AUTOGENERATE(2000)
;
And again the app is attached.
Cheers,
Steve
- Mark as New
- Bookmark
- Subscribe
- Mute
- Subscribe to RSS Feed
- Permalink
- Report Inappropriate Content
Hi @Goncalo
One way of achieving this is:
=if(rank(sum(Spend)) <= 20, sum(Spend), null())You will need to have the Supplier as a dimension and stack them for this approach to work.
The one drawback I can see is if there are two suppliers with the same spend in the year at position 20 then both could get included.
Hope that moves you forward.
Steve
- Mark as New
- Bookmark
- Subscribe
- Mute
- Subscribe to RSS Feed
- Permalink
- Report Inappropriate Content
Hi @stevedark
Thanks for the feedback!
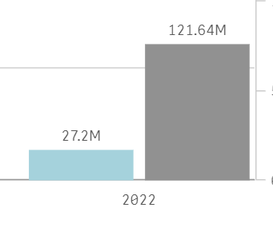
The current formula I am using already groups spend by supplier. The issue is that if I don't select a specific year, it will look for the spend by supplier for all years and then looks for the top 20 in this timeframe.
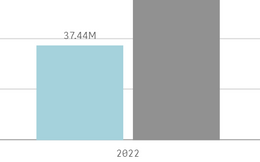
However, if I select one year the value changes as it is only looking for the top 20 for that year.
Chart data without a year selected:
Chart data with 2022 selected:
I would like to see the 37.44M with or without a year selected.
I am guessing I would need to aggregate by year before checking the top 20 suppliers, but it did not work in the iterations I tried.
Any suggestions?
- Mark as New
- Bookmark
- Subscribe
- Mute
- Subscribe to RSS Feed
- Permalink
- Report Inappropriate Content
Hi @Goncalo
The expression I gave the first time out required that the Supplier was one of the dimensions, without that you will need to add it into the aggr.
So, the expression is now:
=sum(aggr(if(rank(sum(Spend)) <= 20, sum(Spend), null()), Year, Supplier))This screengrab shows it working, with the 2020 value being the same regardless of selection.
Test data generated with:
Random:
LOAD
    chr(65 + floor(rand()*4)) & chr(65 + floor(rand()*26)) as Supplier,
    2019 + floor(rand()*4) as Year,
    ceil(rand()*1000) as Spend
AUTOGENERATE(500)
;
The whole app is attached should you want to take a look.
Hope that helps.
Steve
- Mark as New
- Bookmark
- Subscribe
- Mute
- Subscribe to RSS Feed
- Permalink
- Report Inappropriate Content
Thanks Steve! It is working perfectly!
- Mark as New
- Bookmark
- Subscribe
- Mute
- Subscribe to RSS Feed
- Permalink
- Report Inappropriate Content
Thanks for confirming @Goncalo , and thanks for marking as the solution - this really helps other Community members.
Cheers,
Steve
- Mark as New
- Bookmark
- Subscribe
- Mute
- Subscribe to RSS Feed
- Permalink
- Report Inappropriate Content
Hi @stevedark I have one follow-up question on this, perhaps it is a variation of your solution.
I added a drilldown with Year and Month, but the values for the months are not showing the correct figures, i.e., the value per year is correct, but once I click to see the spend by month, the values do not match the actual month spend figures.
Thanks!
- Mark as New
- Bookmark
- Subscribe
- Mute
- Subscribe to RSS Feed
- Permalink
- Report Inappropriate Content
Hi @Goncalo
I think the way you approach it for months would have to be different, as you are working out the top 20 at a different level of dimensionality from what the chart is at.
I think that this code should do it:
=if(GetPossibleCount(Year) > 1,
sum(aggr(if(rank(sum(Spend)) <= 20, sum(Spend), null()), Year, Supplier)),
sum({<Supplier={'$(=concat(TOTAL aggr(if(rank(sum(Spend)) <= 20, Supplier, null()), Supplier), chr(39) & ',' & chr(39)))'}>} Spend))
You will recognize the old expression in there (in italics), the other expression gets the list of suppliers outside of the expression and then injects it in using Set Analysis.
The loaded script to test this one is:
Random:
LOAD
*,
Year(Month) as Year
;
LOAD
chr(65 + floor(rand()*4)) & chr(65 + floor(rand()*26)) as Supplier,
Date(AddMonths(makedate(2019,1), floor(rand()*48)), 'MMM-YYYY') as Month,
ceil(rand()*1000) as Spend
AUTOGENERATE(2000)
;
And again the app is attached.
Cheers,
Steve
- Mark as New
- Bookmark
- Subscribe
- Mute
- Subscribe to RSS Feed
- Permalink
- Report Inappropriate Content
Hi @stevedark!
Again, many thanks for your help! The code above was not working for months right away. I believe it may be due to the way the data model I'm using is set up, which I was not able to explain properly.
However, by looking at your approach I repeated the first part of the if in the second part and replaced the Year by Month, and it worked!
=if(GetPossibleCount(Year) > 1,
sum(aggr(if(rank(sum(Spend)) <= 20, sum(Spend), null()), Year, Supplier)),
sum(aggr(if(rank(sum(Spend)) <= 20, sum(Spend), null()), Month, Supplier)))
Again, thanks for your support and patience, marked as a solution.
Cheers,
Goncalo
- Mark as New
- Bookmark
- Subscribe
- Mute
- Subscribe to RSS Feed
- Permalink
- Report Inappropriate Content
You might be looking at the top 20 in each month though, rather than the top 20 in the year split across months, or is that what you are after?
Thanks,
Steve
- « Previous Replies
-
- 1
- 2
- Next Replies »


