Unlock a world of possibilities! Login now and discover the exclusive benefits awaiting you.
- Qlik Community
- :
- Forums
- :
- Analytics
- :
- New to Qlik Analytics
- :
- Re: How to calculate a portfolio and group by mont...
- Subscribe to RSS Feed
- Mark Topic as New
- Mark Topic as Read
- Float this Topic for Current User
- Bookmark
- Subscribe
- Mute
- Printer Friendly Page
- Mark as New
- Bookmark
- Subscribe
- Mute
- Subscribe to RSS Feed
- Permalink
- Report Inappropriate Content
How to calculate a portfolio and group by month
Hello hello,
at first, you can find enclosed my sample app for this problem and also the csv-file with the relevant data.
In our app we have 3 KPIs/measures:
The fist "New Acquisitions" shows the started contracts of a time period - in our case all started contracts of 2014 - since 2014 is selected.
The second measure "Ended Contracts" shows - naturally - all ended contracts of the same time period, i.e. again of 2014.
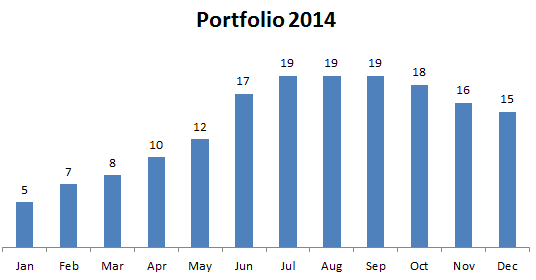
Now, "Portfolio" is supposed to be the total amount of currently active contracts (i.e. started in 2014 or before and End Date >2014). For December 2014 this figure would be 15 (4 started contracts in 2013 plus 15 new contracts in 2014 minus 4 ended contracts of 2014). As a total figure this works fine.
However, if we display "Portfolio" in a bar chart, we only get to see the deltas vs. the previous month (unfortunately also aggregated, i.e. 2013 and 2014 deltas combined):
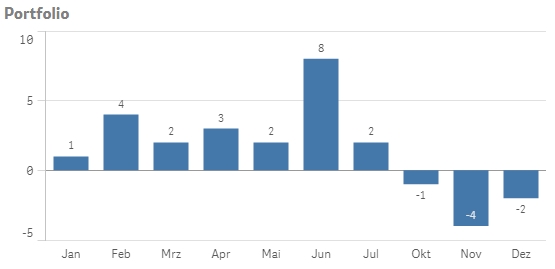
Here is what the bar chat is supposed to look like (taken from Excel):
How can we solve this problem?
Maybe it is also possible to simplify our calculation for the portfolio measure?!
- « Previous Replies
-
- 1
- 2
- Next Replies »
- Mark as New
- Bookmark
- Subscribe
- Mute
- Subscribe to RSS Feed
- Permalink
- Report Inappropriate Content
Hi Targa, sorry for delay but I'm quite busy these days.
You can use a dimension ignoring selections, something like:
Aggr(If(Only({1} CanonicalYear)>=2014 and Only({1} CanonicalYear)<=2018, Only({1} CanonicalYear)), CanonicalYear)
And you should add the 'ignore selections condition' in the expression (The '1' in Set analysis):
Count(TOTAL {$<CanonicalYear = {"<2014"},
CanonicalMonth = ,
DateType = {'Contract_Start'}>}DISTINCT(Contract_Key))
+
Rangesum(Above(
Count ({1<DateType = {'Contract_Start'}>}DISTINCT(Contract_Key))
, 0, RowNo()))
-
(
Count(TOTAL {$<CanonicalYear = {"<2014"},
CanonicalMonth = ,
DateType = {'Contract_End'}>}DISTINCT(Contract_Key))
+
Rangesum(Above(
Count ({1<DateType = {'Contract_End'}>}DISTINCT(Contract_Key))
, 0, RowNo()))
)
Can be debugged to ignore only the year but I'm not sure if that's what you want and also I don't have time to develop.
Hope this helps!
- Mark as New
- Bookmark
- Subscribe
- Mute
- Subscribe to RSS Feed
- Permalink
- Report Inappropriate Content
Thanks Ruben!
It was the right hint for us.
With little adjustments and testing, it is working very well.
Thanks again.
Now, I'm happy 
- « Previous Replies
-
- 1
- 2
- Next Replies »