Unlock a world of possibilities! Login now and discover the exclusive benefits awaiting you.
- Qlik Community
- :
- Forums
- :
- Analytics
- :
- New to Qlik Analytics
- :
- How to change the color of different trend in a gr...
- Subscribe to RSS Feed
- Mark Topic as New
- Mark Topic as Read
- Float this Topic for Current User
- Bookmark
- Subscribe
- Mute
- Printer Friendly Page
- Mark as New
- Bookmark
- Subscribe
- Mute
- Subscribe to RSS Feed
- Permalink
- Report Inappropriate Content
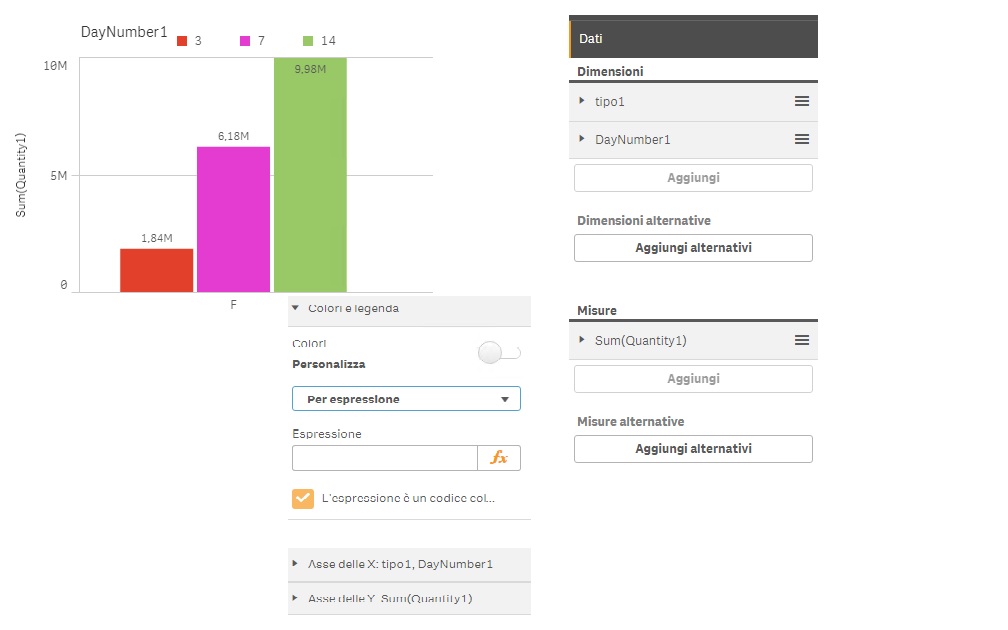
How to change the color of different trend in a graph manually?
Hello everybody,
I am going to change the color of each trend(trend number 3,trend number 7, and trend number 14) to my favourite color in the graph below, I do not know whether i should change the sql code or write a script in qlik, if I should write a code in qlik I do not know whether I should add script in the Data part or in the Color part , I mean changing to my favourite color according to the expression, and I do not know how to define the color in script... I would be thankful if somebody gives a hint,
Thanks
The photo is attached.
- Mark as New
- Bookmark
- Subscribe
- Mute
- Subscribe to RSS Feed
- Permalink
- Report Inappropriate Content
Create a master dimension with this dimension of yours
once created, edit it, and then you can choose the color of each of the values of your dim : 3 , 7 and 14.
Once finished, just drag it on your chart and choose color by dimension
- Mark as New
- Bookmark
- Subscribe
- Mute
- Subscribe to RSS Feed
- Permalink
- Report Inappropriate Content
Thanks for your reply, I added(by drag and drop) the graph to the master items(is this how we create Master Items ?)
and i wanted to edit the master items but i couldn't apply different color,
sorry could you please explain how to create master item for my dimensions ? Thanks
- Mark as New
- Bookmark
- Subscribe
- Mute
- Subscribe to RSS Feed
- Permalink
- Report Inappropriate Content
No create a master Dimension not the graph.
reread my message please