Unlock a world of possibilities! Login now and discover the exclusive benefits awaiting you.
- Qlik Community
- :
- Forums
- :
- Analytics
- :
- New to Qlik Analytics
- :
- How to combine stacked and grouped chart together?
- Subscribe to RSS Feed
- Mark Topic as New
- Mark Topic as Read
- Float this Topic for Current User
- Bookmark
- Subscribe
- Mute
- Printer Friendly Page
- Mark as New
- Bookmark
- Subscribe
- Mute
- Subscribe to RSS Feed
- Permalink
- Report Inappropriate Content
How to combine stacked and grouped chart together?
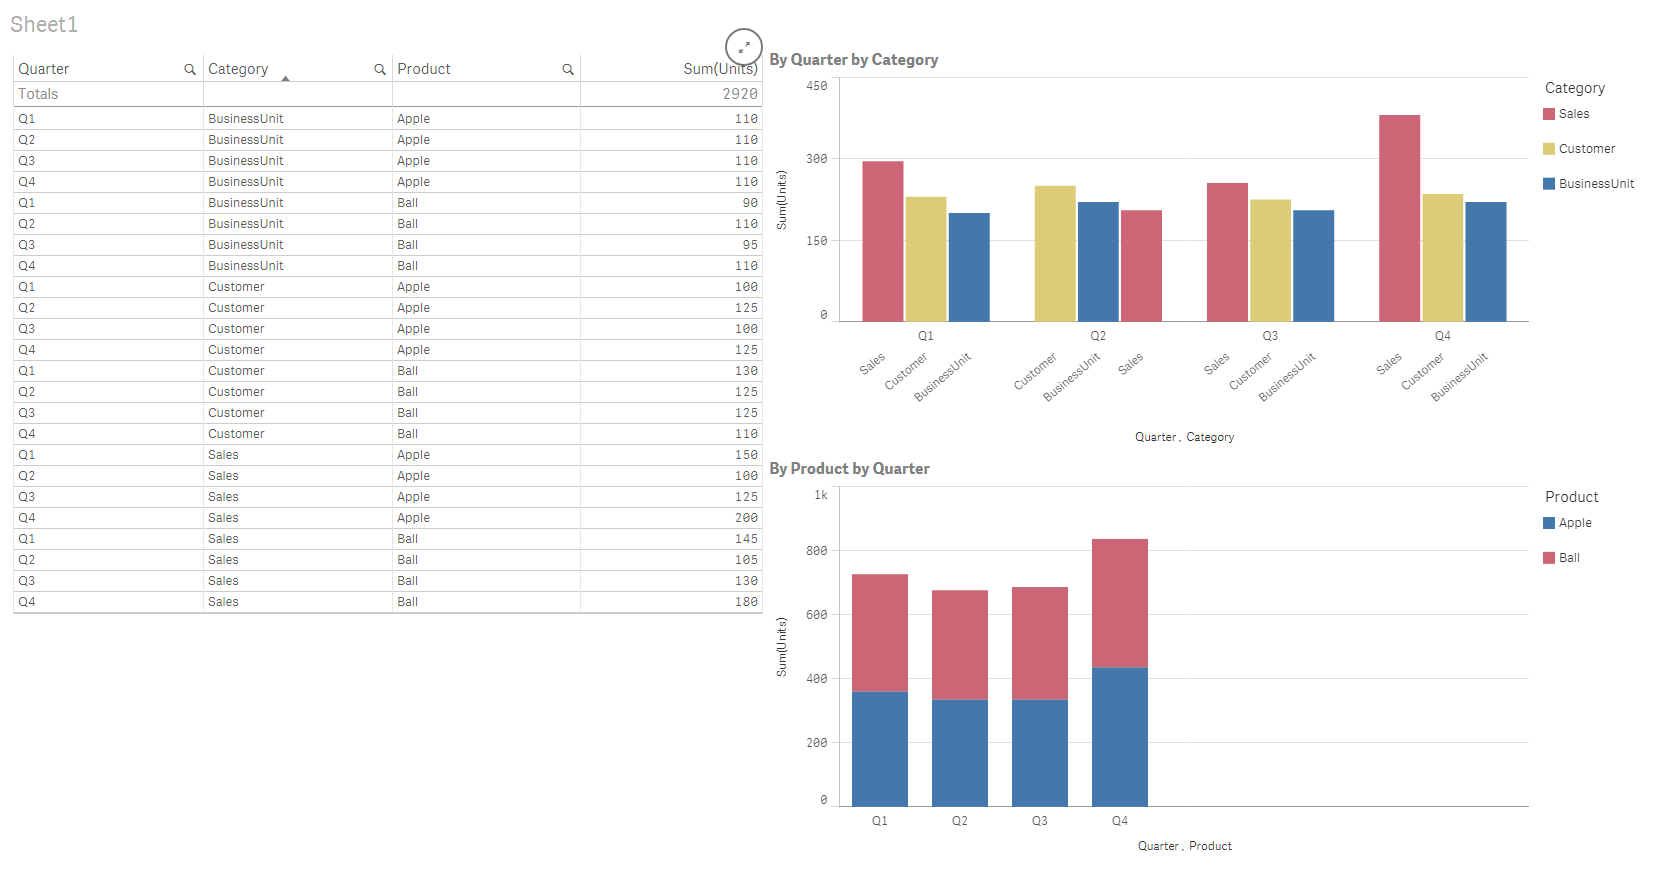
Newbie Sense question...I want to combine the two charts below in to one. It should show product as stacked chart but have both Quarter and Category on X axis. Is there a simple way to do this? I have attached the QS file.
Accepted Solutions
- Mark as New
- Bookmark
- Subscribe
- Mute
- Subscribe to RSS Feed
- Permalink
- Report Inappropriate Content
This one isn't possible. The bars are stacked or grouped with a 3rd dimension (to stack and group) not possible at the current time.
You can do 3 dimensions in a tree map but not sure if that helps.
- Mark as New
- Bookmark
- Subscribe
- Mute
- Subscribe to RSS Feed
- Permalink
- Report Inappropriate Content
Hi Manish, if it can work as a workaround you can create a combo chart, adding as bars:
Sum(Units)
Sum({<Product={'Apple'}>} Units)
Sum({<Product={'Bail'}>} Units)
And adding as lines:
Sum({<Category={'BusinessUnit'}>} Units)
Sum({<Category={'Customer'}>} Units)
Sum({<Category={'Sales'}>} Units)
- Mark as New
- Bookmark
- Subscribe
- Mute
- Subscribe to RSS Feed
- Permalink
- Report Inappropriate Content
Hi Ruben -- thanks. I think this is what you meant. I will check if I can make it more visually appealing.
Would Drill Down dimension work here in any way?

- Mark as New
- Bookmark
- Subscribe
- Mute
- Subscribe to RSS Feed
- Permalink
- Report Inappropriate Content
Do you happen to have any idea if Qlik has included this functionality in their latest versions as this has been a pending problem for more than 3 years now?
- Mark as New
- Bookmark
- Subscribe
- Mute
- Subscribe to RSS Feed
- Permalink
- Report Inappropriate Content
No. Its still (it seems) 2 dimensions and 1 measure
Or 1 dimension and one or more measures
What I would most likely do for this is use a drill down dimension and 4 measures (Q1 Q2 Q3Q 4)
Or look for a extension option