Unlock a world of possibilities! Login now and discover the exclusive benefits awaiting you.
- Qlik Community
- :
- Forums
- :
- Analytics
- :
- New to Qlik Analytics
- :
- How to create a chart with multiple aggregation gr...
- Subscribe to RSS Feed
- Mark Topic as New
- Mark Topic as Read
- Float this Topic for Current User
- Bookmark
- Subscribe
- Mute
- Printer Friendly Page
- Mark as New
- Bookmark
- Subscribe
- Mute
- Subscribe to RSS Feed
- Permalink
- Report Inappropriate Content
How to create a chart with multiple aggregation grouping?
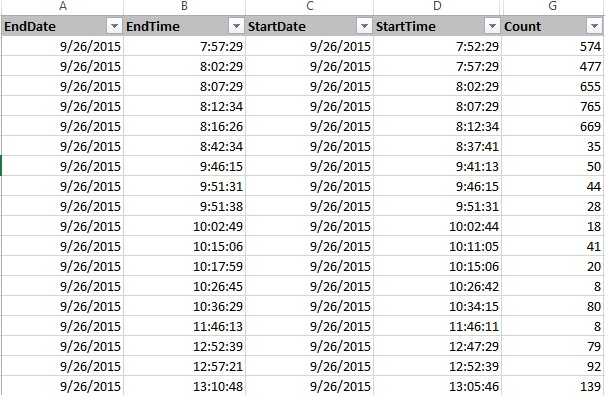
This is my first app with Qlik. I am trying to create a chart where I can see the Hour of the day where I had the max Count. To calculate the max Count first I have to aggregate the Sum of count for each hour.
What kind of chart can be used to achieve this? Or How can I manipulate the data before using it in the chart?
My data looks like this. Here for example rows 2 to 6 contains the count for hour 8. I need to sum by hour and find the max for each date.
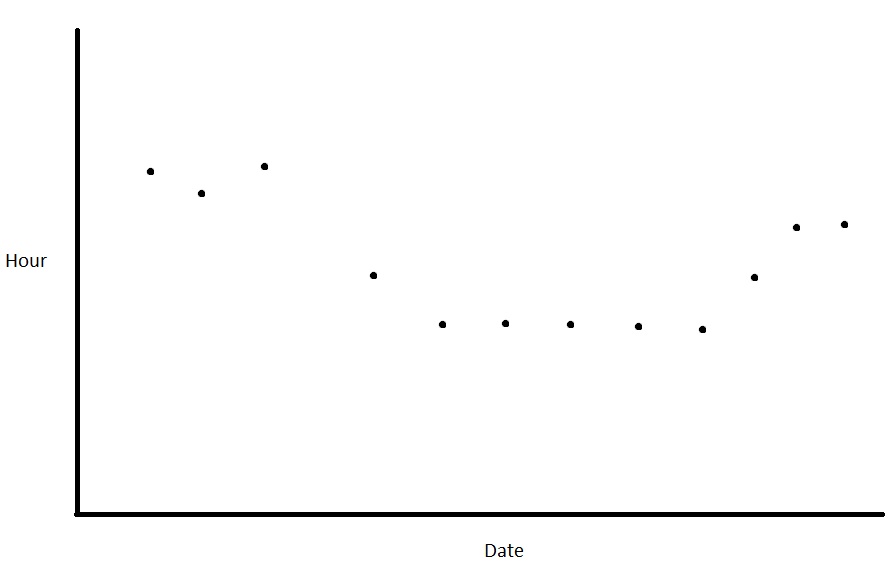
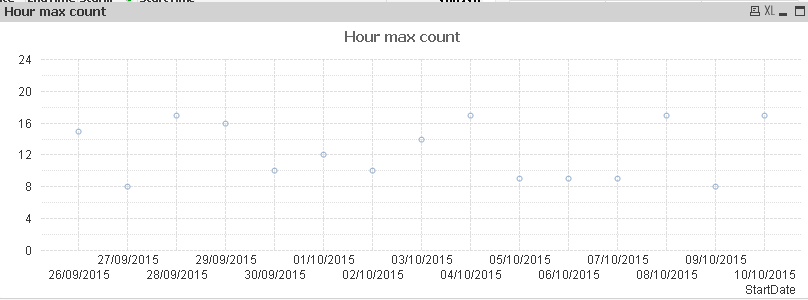
I would like to see an output something like this. Where the dot represent the hour of the day that has max count.
Accepted Solutions
- Mark as New
- Bookmark
- Subscribe
- Mute
- Subscribe to RSS Feed
- Permalink
- Report Inappropriate Content
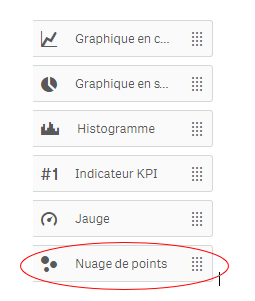
I don't see in Sense graphics with point instead of line,
so this one should wotk :
as dimension :
StartDate
as Measures :
X-axis : only(StartDate)
Y-axis : expression above
regards
- Mark as New
- Bookmark
- Subscribe
- Mute
- Subscribe to RSS Feed
- Permalink
- Report Inappropriate Content
Hi,
could you share your data sample as xlsx please ?
regards
- Mark as New
- Bookmark
- Subscribe
- Mute
- Subscribe to RSS Feed
- Permalink
- Report Inappropriate Content
Here is the sample data
https://drive.google.com/file/d/1GTTmNBQlygT6jAYtJrVCAgb4AWVB_YOS/view?usp=sharing
- Mark as New
- Bookmark
- Subscribe
- Mute
- Subscribe to RSS Feed
- Permalink
- Report Inappropriate Content
Hi,
first in script, add a field StartH as Hour(StartTime)
then in front :
graph with StartDate as dimension
and expression :
FirstSortedValue(total <StartDate> StartH,aggr(sum(Count),StartDate,StartH))
thank's for the sample !
- Mark as New
- Bookmark
- Subscribe
- Mute
- Subscribe to RSS Feed
- Permalink
- Report Inappropriate Content
correction !!
I allways forget : firstsortedvalue gives the min, must change sign to have the max :
FirstSortedValue(total <StartDate> StartH,-aggr(sum(Count),StartDate,StartH))
(minus sign before aggr(sum
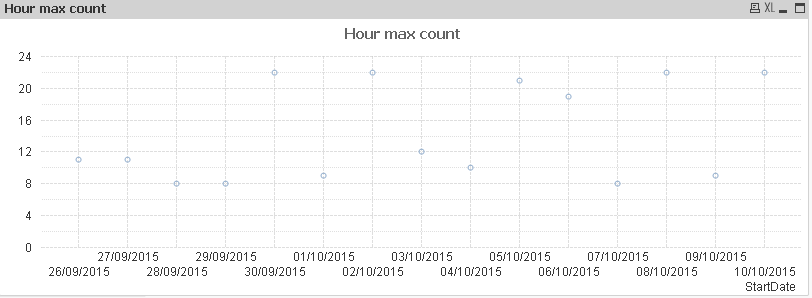
so it's better :
- Mark as New
- Bookmark
- Subscribe
- Mute
- Subscribe to RSS Feed
- Permalink
- Report Inappropriate Content
Thanks Olivier.
So both my X and Y axis will be a Dimension right? Which Chart Type should by using here?
- Mark as New
- Bookmark
- Subscribe
- Mute
- Subscribe to RSS Feed
- Permalink
- Report Inappropriate Content
I don't see in Sense graphics with point instead of line,
so this one should wotk :
as dimension :
StartDate
as Measures :
X-axis : only(StartDate)
Y-axis : expression above
regards