Unlock a world of possibilities! Login now and discover the exclusive benefits awaiting you.
- Qlik Community
- :
- Forums
- :
- Analytics
- :
- New to Qlik Analytics
- :
- How to dynamically change the row and column in Pi...
- Subscribe to RSS Feed
- Mark Topic as New
- Mark Topic as Read
- Float this Topic for Current User
- Bookmark
- Subscribe
- Mute
- Printer Friendly Page
- Mark as New
- Bookmark
- Subscribe
- Mute
- Subscribe to RSS Feed
- Permalink
- Report Inappropriate Content
How to dynamically change the row and column in Pivot Table
Hi I have two questions
1. I have a requirement where I have to dynamically change Row field and Column field in Pivot table, how can I do that ?
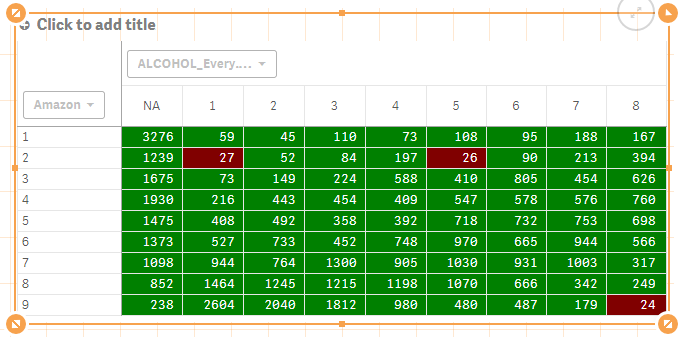
Please see the attached screenshot. Right now row values (NA to 😎 are shown by the field "Alcohol_Every" and Column Values ( 1 to 9) are shown by the field "Amazon". I need to provide two Prompts using which user can pick what they want to show as row and column field. Any one knows how to do it in Qlik Sense ?
2. I have to do the conditional formatting using fractile function. Like for the background color expression of the cells ( Measure ) of Pivot Table I have to use an expression like below. But this gives me "Expression Error " . What am I doing wrong here ?
if (count(POST_CODE) < Fractile(count(POST_CODE),0.2), red(), green())
I will really appreciate any help I can get.
Thanks
Ajay
- Mark as New
- Bookmark
- Subscribe
- Mute
- Subscribe to RSS Feed
- Permalink
- Report Inappropriate Content
For you second issue, may be try like this:
If(Count(POST_CODE) < Fractile(TOTAL Aggr(Count(POST_CODE), Alcohol_Every, Amazon) , 0.2), Red(), Green())
- Mark as New
- Bookmark
- Subscribe
- Mute
- Subscribe to RSS Feed
- Permalink
- Report Inappropriate Content
Not entirely sure what you are looking for in your 1st requirement, but check out the attached and see if that helps