Unlock a world of possibilities! Login now and discover the exclusive benefits awaiting you.
- Qlik Community
- :
- Forums
- :
- Analytics
- :
- New to Qlik Analytics
- :
- How to get 2 measure values in a single bar in q...
- Subscribe to RSS Feed
- Mark Topic as New
- Mark Topic as Read
- Float this Topic for Current User
- Bookmark
- Subscribe
- Mute
- Printer Friendly Page
- Mark as New
- Bookmark
- Subscribe
- Mute
- Subscribe to RSS Feed
- Permalink
- Report Inappropriate Content
How to get 2 measure values in a single bar in qlik sense?
Hi expects,
I have to show count(column1) and percentage (column1) in single bar .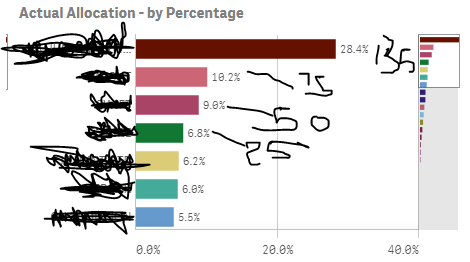
as you can see it should be on same bar and tool tip also fine .
i tried count in measure and percentage in color and i am getting tool tip of both but i am having same related fields charts in sheets so through out i should get same field color .so this method is not much useful .so is there any method to solve this .
thanks,
krishna
Accepted Solutions
- Mark as New
- Bookmark
- Subscribe
- Mute
- Subscribe to RSS Feed
- Permalink
- Report Inappropriate Content
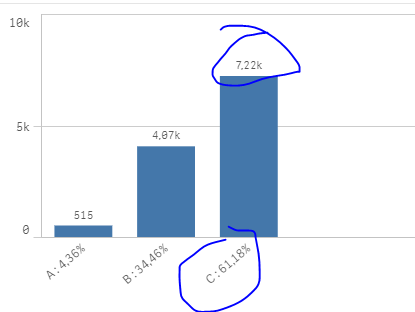
You can't show them on the bar, but you can for example , show the percentage besides the dimension, and the value on the bar:
as dimension =
YourDim&' : '& num(aggr((sum(measure) / sum(total {<YourDim>} measure)),YourDim),'# ##0,00%')
result:
- Mark as New
- Bookmark
- Subscribe
- Mute
- Subscribe to RSS Feed
- Permalink
- Report Inappropriate Content
You can't show them on the bar, but you can for example , show the percentage besides the dimension, and the value on the bar:
as dimension =
YourDim&' : '& num(aggr((sum(measure) / sum(total {<YourDim>} measure)),YourDim),'# ##0,00%')
result: