Unlock a world of possibilities! Login now and discover the exclusive benefits awaiting you.
- Qlik Community
- :
- Forums
- :
- Analytics
- :
- New to Qlik Analytics
- :
- How to show last datapoint in Time-aware charts
Options
- Subscribe to RSS Feed
- Mark Topic as New
- Mark Topic as Read
- Float this Topic for Current User
- Bookmark
- Subscribe
- Mute
- Printer Friendly Page
Turn on suggestions
Auto-suggest helps you quickly narrow down your search results by suggesting possible matches as you type.
Showing results for
Anonymous
Not applicable
2017-01-09
07:36 AM
- Mark as New
- Bookmark
- Subscribe
- Mute
- Subscribe to RSS Feed
- Permalink
- Report Inappropriate Content
How to show last datapoint in Time-aware charts
Hello,
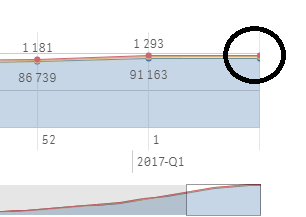
I have made some time-aware charts and I noticed that when choosing to show datapoints, the last point in the series did not show a value. Also, the last datapoint in a line graph or bar in barchart is too narrow to easily point at to get the mousover-hover-field up. This can be critical in a time-aware chart since the last point is often the current date, or atleast the most recent date and, therefore, most interesting.
Is there a way to force this point to show in graphs?
Example:
Regards,
Kristian Kirkeng
462 Views
0 Replies
Community Browser