Unlock a world of possibilities! Login now and discover the exclusive benefits awaiting you.
- Qlik Community
- :
- Forums
- :
- Analytics
- :
- New to Qlik Analytics
- :
- How to sum range of values
- Subscribe to RSS Feed
- Mark Topic as New
- Mark Topic as Read
- Float this Topic for Current User
- Bookmark
- Subscribe
- Mute
- Printer Friendly Page
- Mark as New
- Bookmark
- Subscribe
- Mute
- Subscribe to RSS Feed
- Permalink
- Report Inappropriate Content
How to sum range of values
Hi everybody,
I need your help with this issue:
I just trying to consolidate the values from January to Month-N (N= someone month) as a filter, because I need to reflect the total in a pivot table. Let me give an example with this table:
MONTH= Dimension
PEOPLE_IN: Measure
PEOPLE_OUT: Measure
| MONTH | PEOPLE_IN | PEOPLE_OUT |
|---|---|---|
| JANUARY | 150 | 200 |
| FEBRARY | 200 | 220 |
| MARCH | 178 | 180 |
| APRIL | 180 | 190 |
| MAY | 190 | 210 |
| JUNE | 150 | 120 |
| JULY | 170 | 130 |
| AGOST | 160 | 180 |
| SEPTEMBER | 185 | 198 |
| OCTUBER | 190 | 140 |
| NOVEMBER | 200 | 130 |
| DICEMBER | 110 | 150 |
If I select January the table show it only the values from January, but if I select March the table should show me the total value from Jan to March (Jan+Feb+March) at the same time the filter should select all months back.
Filter: Jan
Select Jan
| MONTH | PEOPLE_IN | PEOPLE_OUT | |
|---|---|---|---|
| JANUARY | 150 | 200 |
Filter: Jan+Feb+March
Select Jan to March
| MONTH | PEOPLE_IN | PEOPLE_OUT |
|---|---|---|
| JANUARY | 528 | 600 |
| FEBRARY | 528 | 600 |
| MARCH | 528 | 600 |
I believe that Sum(Total.....) might be a possible but really I don't know how used and how to do this.
I hope you can help me.
PD. Sorry if my english have some mistakes...
- « Previous Replies
-
- 1
- 2
- Next Replies »
Accepted Solutions
- Mark as New
- Bookmark
- Subscribe
- Mute
- Subscribe to RSS Feed
- Permalink
- Report Inappropriate Content
then change the expression as follow:
if(GetSelectedCount(MONTH)=0,sum(PEOPLE_IN), sum(total {1<NumMonth={"<=$(=max(NumMonth))"}>}PEOPLE_IN))
if(GetSelectedCount(MONTH)=0,sum(PEOPLE_OUT), sum(total {1<NumMonth={"<=$(=max(NumMonth))"}>}PEOPLE_OUT))
- Mark as New
- Bookmark
- Subscribe
- Mute
- Subscribe to RSS Feed
- Permalink
- Report Inappropriate Content
1)create a numeric month in ur script (01,02,03...)
if u have a date field: do date(dateField,'MM') as NumMonth
then, in the expression; in the table, instead of :
sum(YourMeasure)
replace it by:
sum(total {<NumMonth={"<=$(=max(NumMonth))"}>}YourMeasure)
- Mark as New
- Bookmark
- Subscribe
- Mute
- Subscribe to RSS Feed
- Permalink
- Report Inappropriate Content
Maybe an AsOf table in your data model might help you achieve what you want:
- Mark as New
- Bookmark
- Subscribe
- Mute
- Subscribe to RSS Feed
- Permalink
- Report Inappropriate Content
But he's not cumulating here Stefan to use the as-of table as it is? no?
- Mark as New
- Bookmark
- Subscribe
- Mute
- Subscribe to RSS Feed
- Permalink
- Report Inappropriate Content
Hi guys,
Thanks for answer me. I going to check the options and I'll report about it.
Thanks.
- Mark as New
- Bookmark
- Subscribe
- Mute
- Subscribe to RSS Feed
- Permalink
- Report Inappropriate Content
Hi,
Is this what you expect as your output ?
| MONTH | PEOPLE_IN | PEOPLE_OUT |
|---|---|---|
| JANUARY | 528 | 200 |
| FEBRARY | 528 | 420 |
| MARCH | 528 | 600 |
- Mark as New
- Bookmark
- Subscribe
- Mute
- Subscribe to RSS Feed
- Permalink
- Report Inappropriate Content
sorry, please ignore the one sent earlier and consider this.
Is this what you expect as your output ?
| MONTH | PEOPLE_IN | PEOPLE_OUT |
|---|---|---|
| JANUARY | 150 | 200 |
| FEBRARY | 300 | 420 |
| MARCH | 528 | 600 |
- Mark as New
- Bookmark
- Subscribe
- Mute
- Subscribe to RSS Feed
- Permalink
- Report Inappropriate Content
Example:
1) I created a NumMonth field in the script (01 02 ...)
2) I add a filter : MONTH
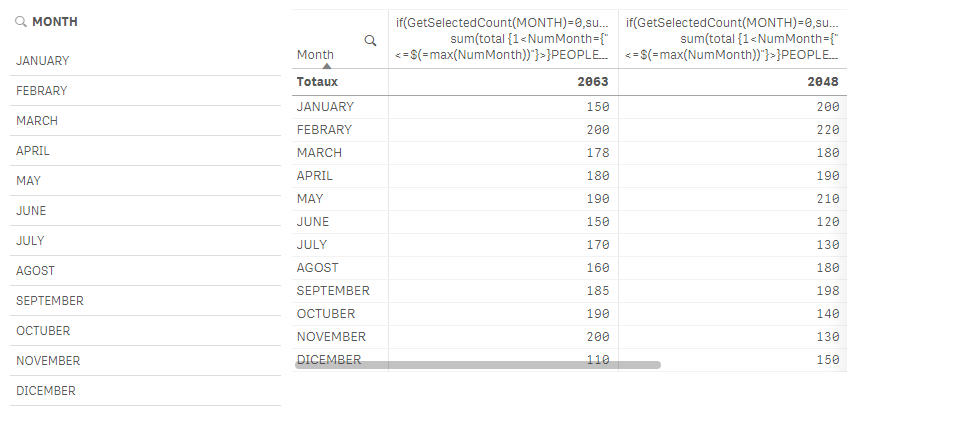
3) Create a table:
Dimension: =if(GetSelectedCount( MONTH)=0,MONTH, 'Until '&MONTH)
Measure 1 : sum(total {1<NumMonth={"<=$(=max(NumMonth))"}>}PEOPLE_IN)
Measure 2 : sum(total {1<NumMonth={"<=$(=max(NumMonth))"}>}PEOPLE_OUT)
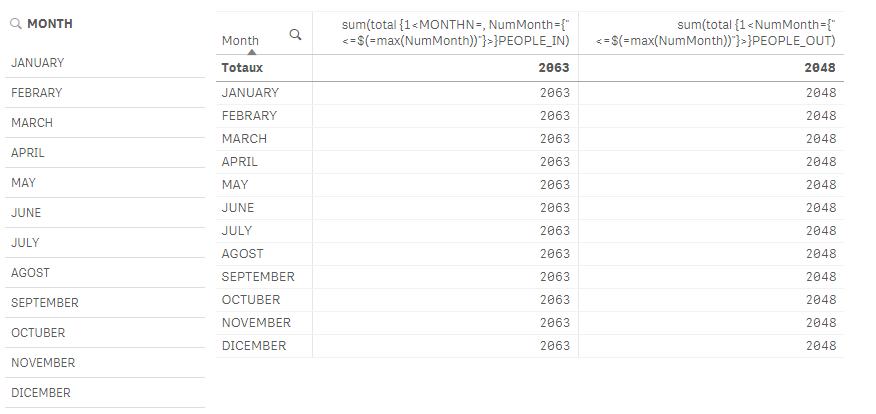
Result :
If I don't make any selection:
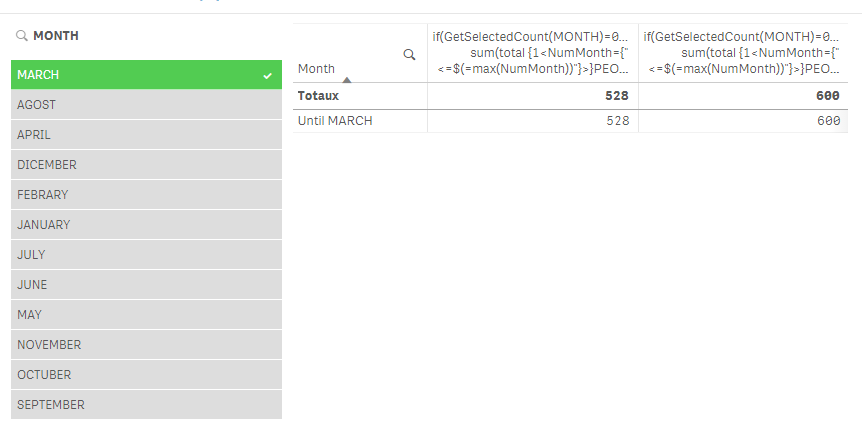
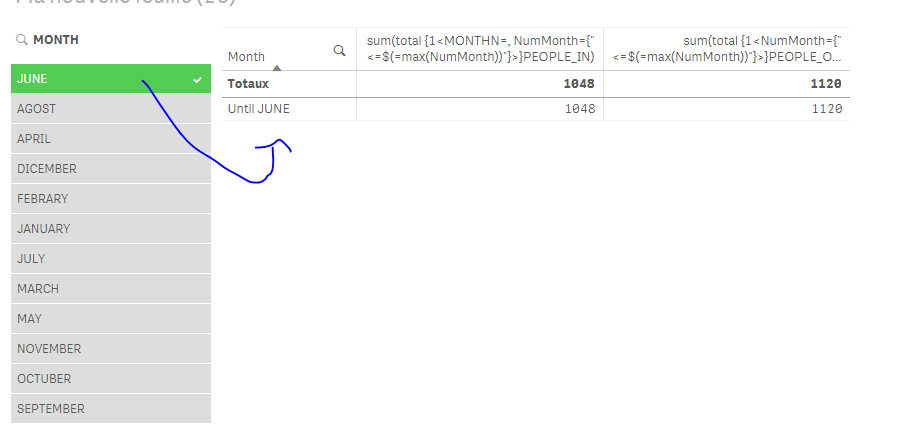
If I select a MONTH:
- Mark as New
- Bookmark
- Subscribe
- Mute
- Subscribe to RSS Feed
- Permalink
- Report Inappropriate Content
Create a field in the script as below.
Num(Month(Date#(Month,'MMM'))) as Num_Month
People In Expression : RANGESUM(above(sum({<Num_Month = {'>=$(1)<=$(=max(Num_Month))'}>}PEOPLE_IN), 0, RowNo()))
People out Expression : RANGESUM(above(sum({<Num_Month = {'>=$(1)<=$(=max(Num_Month))'}>}PEOPLE_OUT), 0, RowNo()))
- Mark as New
- Bookmark
- Subscribe
- Mute
- Subscribe to RSS Feed
- Permalink
- Report Inappropriate Content
This solution will give you the below result, if that is what you're looking for :
| MONTH | PEOPLE_IN | PEOPLE_OUT |
|---|---|---|
| JANUARY | 150 | 200 |
| FEBRARY | 300 | 420 |
| MARCH | 528 | 600 |
- « Previous Replies
-
- 1
- 2
- Next Replies »