Unlock a world of possibilities! Login now and discover the exclusive benefits awaiting you.
- Qlik Community
- :
- Forums
- :
- Analytics
- :
- New to Qlik Analytics
- :
- In which real time scenario, we can multiple measu...
- Subscribe to RSS Feed
- Mark Topic as New
- Mark Topic as Read
- Float this Topic for Current User
- Bookmark
- Subscribe
- Mute
- Printer Friendly Page
- Mark as New
- Bookmark
- Subscribe
- Mute
- Subscribe to RSS Feed
- Permalink
- Report Inappropriate Content
In which real time scenario, we can multiple measures and dimension?
I am using Qlik sense for 5 months from now. Mostly I used only single dimension and single measure, but Qlik sense provides an option to add more than 1 measure and dimension.
So can anyone tell me that in which real-time scenario we can use multi measures?
Thanks
Dilip Solanki
Dilip Solanki
- Tags:
- multiple measure
- Mark as New
- Bookmark
- Subscribe
- Mute
- Subscribe to RSS Feed
- Permalink
- Report Inappropriate Content
Hi,
If you want to compare two measures, like sales this year and last year. Combo chart or table might be good alternatives. You could also do this if you want to se the realtion between to measures, like profit and sales volume in for example a scatterplot.
Erik Wetterberg
- Mark as New
- Bookmark
- Subscribe
- Mute
- Subscribe to RSS Feed
- Permalink
- Report Inappropriate Content
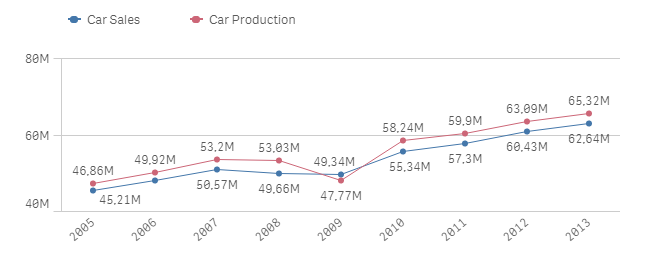
u can for example compare car sales vs car production by year.
For that, u use one dimension: year
and 2 measures: car sales and car production:
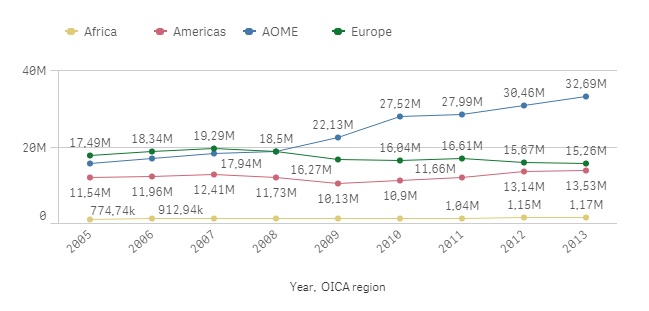
a second scenario is that u want to compare the car sales by regions over the year.
To do the that, u use 2 dimensions: Year, Region
and one measure: sum(car sales)
Hope that was helpful