Unlock a world of possibilities! Login now and discover the exclusive benefits awaiting you.
- Qlik Community
- :
- Forums
- :
- Analytics
- :
- New to Qlik Analytics
- :
- Interactive Legend in Stacked Bar
- Subscribe to RSS Feed
- Mark Topic as New
- Mark Topic as Read
- Float this Topic for Current User
- Bookmark
- Subscribe
- Mute
- Printer Friendly Page
- Mark as New
- Bookmark
- Subscribe
- Mute
- Subscribe to RSS Feed
- Permalink
- Report Inappropriate Content
Interactive Legend in Stacked Bar
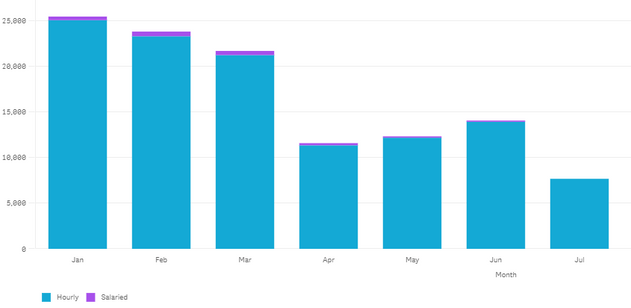
I have created a stacked bar, with one dimension(Month) and two measures. When I click on the legend at the bottom left(Hourly or Salaried), it doesn't drill down, please suggest a way with code to make legends interactive and drill down upon selecting.
- Subscribe by Topic:
-
Custom Component
-
Customize
-
Drill-Down
-
legends
-
SaaS
-
Stacked Bar
-
Stacked Bars
Accepted Solutions
- Mark as New
- Bookmark
- Subscribe
- Mute
- Subscribe to RSS Feed
- Permalink
- Report Inappropriate Content
HI
in that case you can create a dimension with valuelist that has the 2 values and use single expression
so your chart will look like this
first dimension : Month
second dimension : valuelist('Hourly','Salaried')
expression: if( valuelist('Hourly','Salaried')='Hourly',sum(Hourly),Sum(Salaried))
- Mark as New
- Bookmark
- Subscribe
- Mute
- Subscribe to RSS Feed
- Permalink
- Report Inappropriate Content
HI
the legend is measures , so why do you expect them to drill down , there is no drill down of measures
what do you mean by drill down , what behavior you are looking for ?
can you elaborate little more
- Mark as New
- Bookmark
- Subscribe
- Mute
- Subscribe to RSS Feed
- Permalink
- Report Inappropriate Content
Hi, the requirement is, when I click on salaried legend, the graph should change to salaried bar and show only salaried ones.
- Mark as New
- Bookmark
- Subscribe
- Mute
- Subscribe to RSS Feed
- Permalink
- Report Inappropriate Content
HI
in that case you can create a dimension with valuelist that has the 2 values and use single expression
so your chart will look like this
first dimension : Month
second dimension : valuelist('Hourly','Salaried')
expression: if( valuelist('Hourly','Salaried')='Hourly',sum(Hourly),Sum(Salaried))
