Unlock a world of possibilities! Login now and discover the exclusive benefits awaiting you.
- Qlik Community
- :
- Forums
- :
- Analytics
- :
- New to Qlik Analytics
- :
- Is it possible to take 2 fields in one pie
- Subscribe to RSS Feed
- Mark Topic as New
- Mark Topic as Read
- Float this Topic for Current User
- Bookmark
- Subscribe
- Mute
- Printer Friendly Page
- Mark as New
- Bookmark
- Subscribe
- Mute
- Subscribe to RSS Feed
- Permalink
- Report Inappropriate Content
Is it possible to take 2 fields in one pie
In Qlik Sense is that possible to take 2 Fields on one pie chart ?
- « Previous Replies
-
- 1
- 2
- Next Replies »
- Mark as New
- Bookmark
- Subscribe
- Mute
- Subscribe to RSS Feed
- Permalink
- Report Inappropriate Content
Hi,
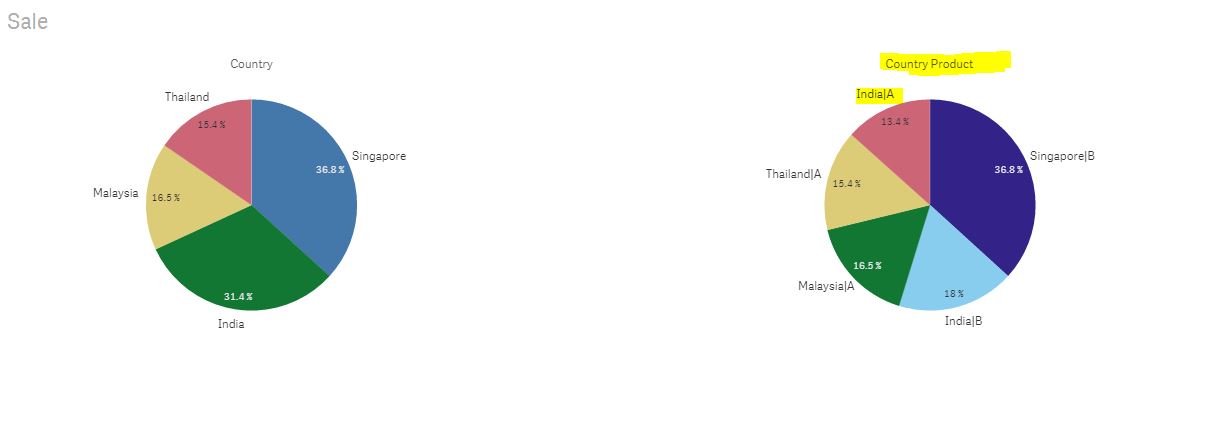
by default nature pic only one dimension use, if u want u can combine them as new calculated dimension and use it
load *, Country &'|'& Product as [Country Product];
load * Inline [
Country,Product,Sales
India,A,104
India,B,140
Singapore,B,147
Singapore,B,139
Malaysia,A,128
Thailand,A,120
];
- Mark as New
- Bookmark
- Subscribe
- Mute
- Subscribe to RSS Feed
- Permalink
- Report Inappropriate Content
I have total count of people and out of that total I have this **** people count
So I have to show total and also out of.
Ex: 30 out of 100
I have to show 100 and 30
But both are two columns in one table
- Mark as New
- Bookmark
- Subscribe
- Mute
- Subscribe to RSS Feed
- Permalink
- Report Inappropriate Content
Hi,
Can you share your mock data. thanks
- Mark as New
- Bookmark
- Subscribe
- Mute
- Subscribe to RSS Feed
- Permalink
- Report Inappropriate Content
I have total count in one column 30000
I have orphan count in other column is 200
- Mark as New
- Bookmark
- Subscribe
- Mute
- Subscribe to RSS Feed
- Permalink
- Report Inappropriate Content
So I have to show 200 orphan out of total 30000
I have to show this in pie
- Mark as New
- Bookmark
- Subscribe
- Mute
- Subscribe to RSS Feed
- Permalink
- Report Inappropriate Content
Hi,
for your case Bar chart is best instead of pie chart (pie chart suitable when u have one measure and one dim)
- Mark as New
- Bookmark
- Subscribe
- Mute
- Subscribe to RSS Feed
- Permalink
- Report Inappropriate Content
Ya, here I have 2 measures.
So for 2 measures we can’t right in pie?
- Mark as New
- Bookmark
- Subscribe
- Mute
- Subscribe to RSS Feed
- Permalink
- Report Inappropriate Content
- Mark as New
- Bookmark
- Subscribe
- Mute
- Subscribe to RSS Feed
- Permalink
- Report Inappropriate Content
HI,
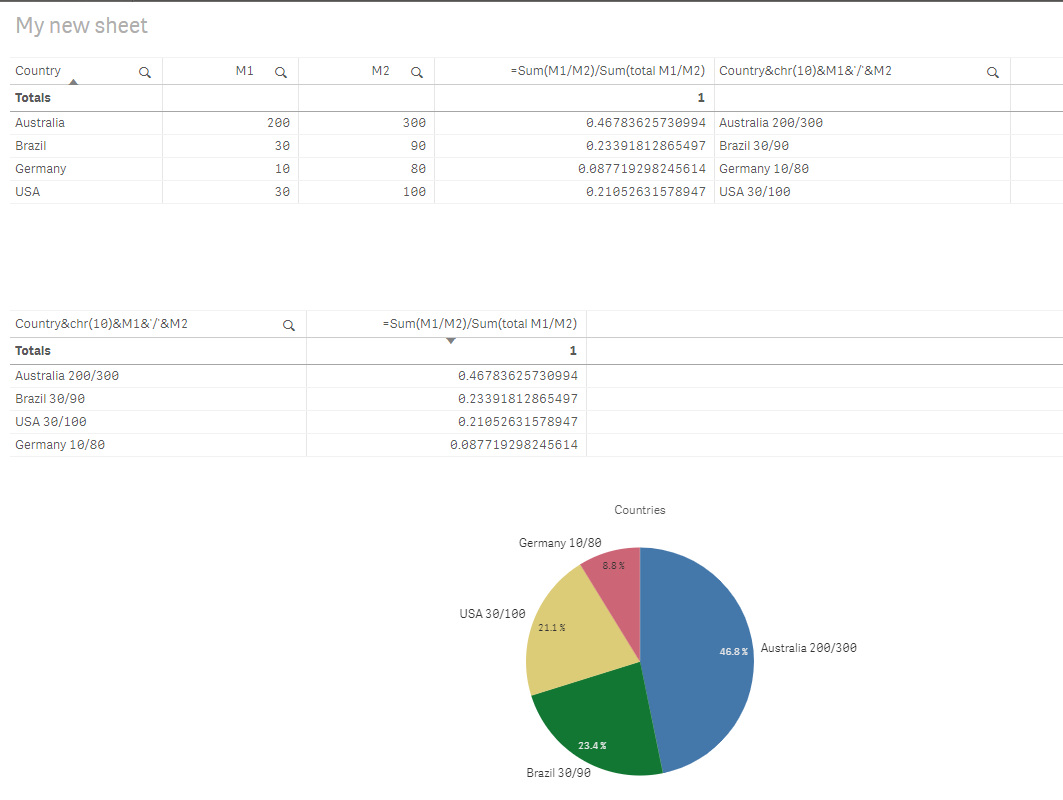
You need to be able to combine those measure into something meaningful relative to each other.. Please see below example.
I hope this helps,
- « Previous Replies
-
- 1
- 2
- Next Replies »