Unlock a world of possibilities! Login now and discover the exclusive benefits awaiting you.
- Qlik Community
- :
- Forums
- :
- Analytics
- :
- New to Qlik Analytics
- :
- Line Chart - 2 measures - color by expression
- Subscribe to RSS Feed
- Mark Topic as New
- Mark Topic as Read
- Float this Topic for Current User
- Bookmark
- Subscribe
- Mute
- Printer Friendly Page
- Mark as New
- Bookmark
- Subscribe
- Mute
- Subscribe to RSS Feed
- Permalink
- Report Inappropriate Content
Line Chart - 2 measures - color by expression
Hi all,
Can someone please help me to understand how to implement 2 colors in a line chart.
I want each line will be other color (blue and green) what is the best way to implement it?
- « Previous Replies
-
- 1
- 2
- Next Replies »
- Mark as New
- Bookmark
- Subscribe
- Mute
- Subscribe to RSS Feed
- Permalink
- Report Inappropriate Content
- Mark as New
- Bookmark
- Subscribe
- Mute
- Subscribe to RSS Feed
- Permalink
- Report Inappropriate Content
Thanks but i didnt see the solution in your link ...  what is the right expression if for 2 meausres and colors?
- Mark as New
- Bookmark
- Subscribe
- Mute
- Subscribe to RSS Feed
- Permalink
- Report Inappropriate Content
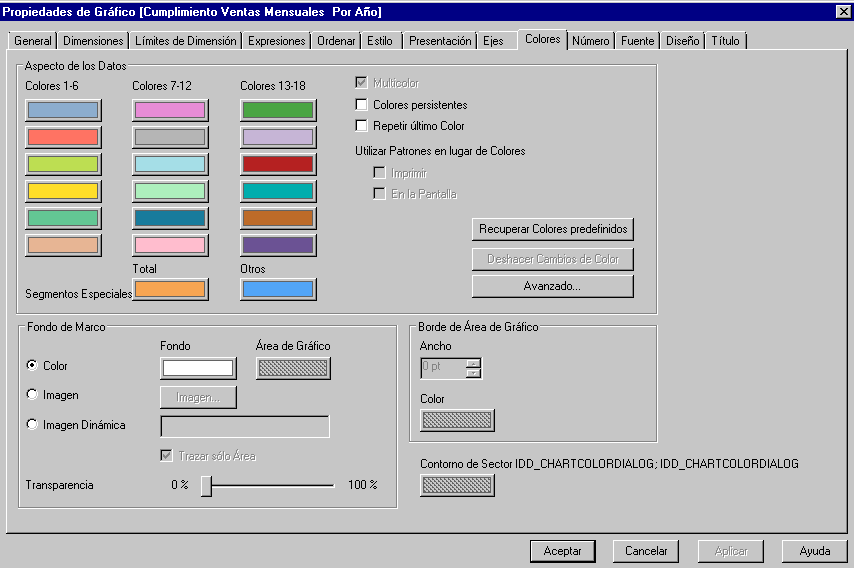
*In chart properties see colors there can specify colors for each of the axes
*
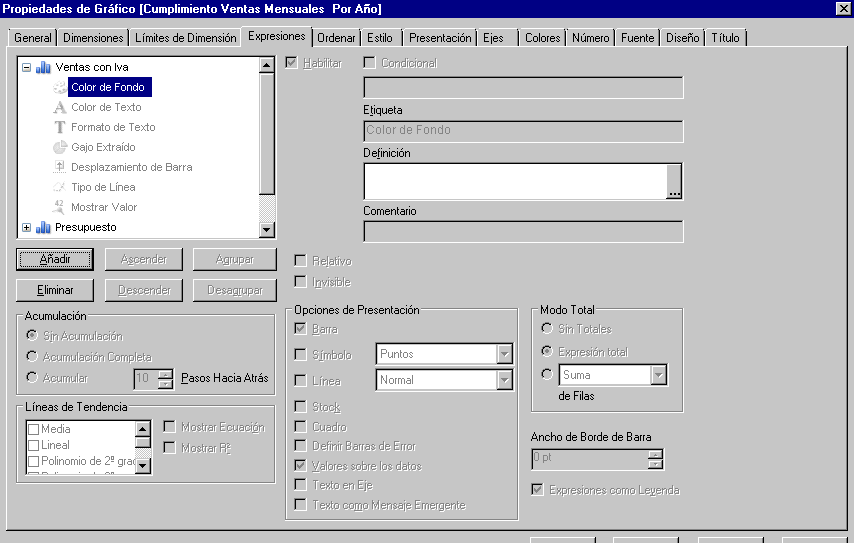
If you want to put dynamic colors you can expand the  on expressions of your chart and put colors through conditions
- Mark as New
- Bookmark
- Subscribe
- Mute
- Subscribe to RSS Feed
- Permalink
- Report Inappropriate Content
My case is in qlik sense....
- Mark as New
- Bookmark
- Subscribe
- Mute
- Subscribe to RSS Feed
- Permalink
- Report Inappropriate Content
If it is Qlik Sense, try this. It holds good for Line Chart as well.
- Mark as New
- Bookmark
- Subscribe
- Mute
- Subscribe to RSS Feed
- Permalink
- Report Inappropriate Content
Thanks, but my case is with calculated measures (set analysis) and not dimentions...what do you think?
- Mark as New
- Bookmark
- Subscribe
- Mute
- Subscribe to RSS Feed
- Permalink
- Report Inappropriate Content
If you can post a sample qvf with some test data, it would be easier
- Mark as New
- Bookmark
- Subscribe
- Mute
- Subscribe to RSS Feed
- Permalink
- Report Inappropriate Content
Hi
See this link that should help you
https://community.qlik.com/message/921010#921010
there is en App example attached very usefull and you will read 2 approch to test with your data :
First with synthetic dimension with value list
second by adding mesure in your script (App example)
May be first one will be more efficient due to set analysis mesure
Regards
- Mark as New
- Bookmark
- Subscribe
- Mute
- Subscribe to RSS Feed
- Permalink
- Report Inappropriate Content
Thats worked 
Thank you very much!
but now the problem that i dont have a legand per maures
I hope in the next version qlik will add the option to change the color easily and not with expression.
- « Previous Replies
-
- 1
- 2
- Next Replies »