Unlock a world of possibilities! Login now and discover the exclusive benefits awaiting you.
- Qlik Community
- :
- Forums
- :
- Analytics
- :
- New to Qlik Analytics
- :
- Re: Line Chart Date Dimension Formatting
- Subscribe to RSS Feed
- Mark Topic as New
- Mark Topic as Read
- Float this Topic for Current User
- Bookmark
- Subscribe
- Mute
- Printer Friendly Page
- Mark as New
- Bookmark
- Subscribe
- Mute
- Subscribe to RSS Feed
- Permalink
- Report Inappropriate Content
Line Chart Date Dimension Formatting
Hi,
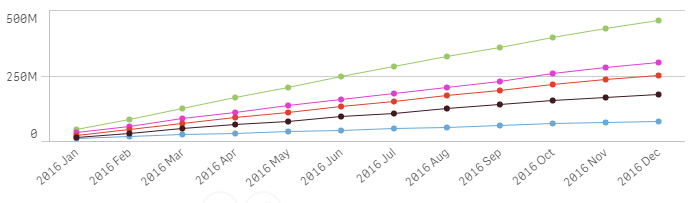
I need to show Line Chart Year-Month dimension same like coming in Combo Chart (load format). But in line chart it's changing formatting of the Year-Month Dimension. I need to do a line chart because of the area feature there but Y-M dim is creating a problem. How to turn off auto date drill in/up when we scroll up and scroll down in line chart.
Line Chart:
Combo Chart: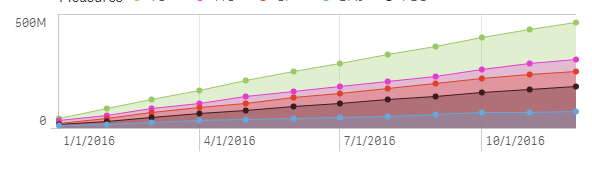
Accepted Solutions
- Mark as New
- Bookmark
- Subscribe
- Mute
- Subscribe to RSS Feed
- Permalink
- Report Inappropriate Content
hi
in the chart properties go to x-axis
change the continuous to custom
and than uncheck the "use continuous scale"
- Mark as New
- Bookmark
- Subscribe
- Mute
- Subscribe to RSS Feed
- Permalink
- Report Inappropriate Content
hi
in the chart properties go to x-axis
change the continuous to custom
and than uncheck the "use continuous scale"
- Mark as New
- Bookmark
- Subscribe
- Mute
- Subscribe to RSS Feed
- Permalink
- Report Inappropriate Content
Thank you. Exactly what i was looking for.
In my case, the bar chart with the same date dimension shows expected date format, but the line chart does not. Your solution fixes. Is this a qlik bug?
Although Qlik is great with visualizations, I feel like there's always something wrong with Qlik when developing an app.