Unlock a world of possibilities! Login now and discover the exclusive benefits awaiting you.
- Qlik Community
- :
- Forums
- :
- Analytics
- :
- New to Qlik Analytics
- :
- Re: Multiple Bar & Area Chart doesnt work properly
- Subscribe to RSS Feed
- Mark Topic as New
- Mark Topic as Read
- Float this Topic for Current User
- Bookmark
- Subscribe
- Mute
- Printer Friendly Page
- Mark as New
- Bookmark
- Subscribe
- Mute
- Subscribe to RSS Feed
- Permalink
- Report Inappropriate Content
Multiple Bar & Area Chart doesnt work properly
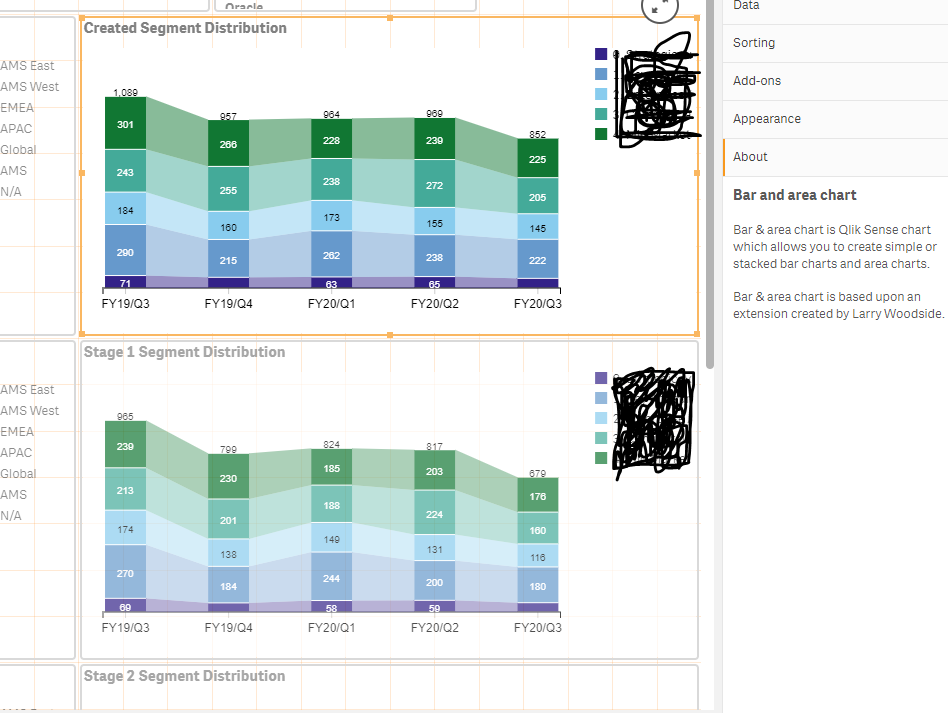
I am using 'Bar and area chart' under the Qlik Visualization bundle. I added 4 charts on one sheet (basically, created the first one and copied remaining 3 with minor tweaks). However, only the first one shows up properly. The remaining three don't show up at all or show up intermittently. The charts appear properly in the edit mode, but when I save it, it dissapears from the view. This is a strange behaviour. Can someone please help me understand what's happening here and fix this?
I am new to Qlik Sense, not very familiar with the concept of visualization bundles. Are these not supported bt Qlik?
Edit Mode: Second chart can be seen here.

View mode: Second chart disappears.

- Mark as New
- Bookmark
- Subscribe
- Mute
- Subscribe to RSS Feed
- Permalink
- Report Inappropriate Content
@Michael_Tarallo Can you please look into this? Seems like a bug?
- Mark as New
- Bookmark
- Subscribe
- Mute
- Subscribe to RSS Feed
- Permalink
- Report Inappropriate Content
Hi Sukanto - you can report this here - please see this link:
https://support.qlik.com/articles/000043153
Mike Tarallo
Qlik
- Mark as New
- Bookmark
- Subscribe
- Mute
- Subscribe to RSS Feed
- Permalink
- Report Inappropriate Content
This really doesn't work for me. Hope this was simpler! Bug free maybe! I go through the case wizard, select my problem type but cant move forward as the login page doesnt work.
My login works on the site - https://www.qlik.com/us/
But not on - https://support.qlik.com/QS_Home_Page
Super frustrating! ☹️
- Mark as New
- Bookmark
- Subscribe
- Mute
- Subscribe to RSS Feed
- Permalink
- Report Inappropriate Content
I sent to a few people to investigate
Mike Tarallo
Qlik
- Mark as New
- Bookmark
- Subscribe
- Mute
- Subscribe to RSS Feed
- Permalink
- Report Inappropriate Content
Thanks Mike. I can log a case now, and have logged this issue.
- Mark as New
- Bookmark
- Subscribe
- Mute
- Subscribe to RSS Feed
- Permalink
- Report Inappropriate Content
Hi, I have the same problem with Multiple Bar & Area Chart. I have two Multiple Bar & Area charts on one sheet. First one work perfect every time but second only sometimes.