Unlock a world of possibilities! Login now and discover the exclusive benefits awaiting you.
- Qlik Community
- :
- Forums
- :
- Analytics
- :
- New to Qlik Analytics
- :
- Multiple lines on line chart
- Subscribe to RSS Feed
- Mark Topic as New
- Mark Topic as Read
- Float this Topic for Current User
- Bookmark
- Subscribe
- Mute
- Printer Friendly Page
- Mark as New
- Bookmark
- Subscribe
- Mute
- Subscribe to RSS Feed
- Permalink
- Report Inappropriate Content
Multiple lines on line chart
Hi,
In my dimension I should see the days from the beginning of the year to the max date.
I want to have 3 lines on line chart. One line should calculate the sum of sales in 2016, another line for 2017 etc
I have date format like this
Jan 1 , Feb 1 ...
My chart should look like this
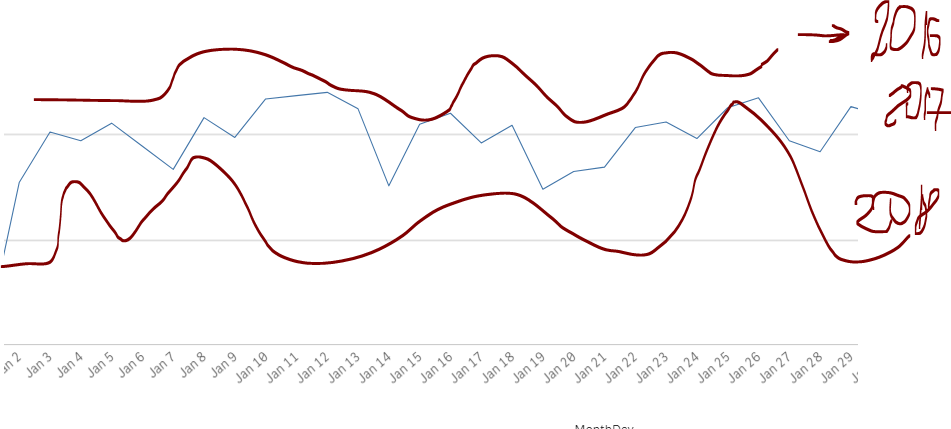
is it possible?
I calculate the sum of sales in 2018 using this formula: SUM({$<Year = {'$(=Max(Year))'}, Month =, Quarter = , date = >}FactSoldAmount)
When I add another dimension for the previous year SUM({$<Year = {'$(=Max(Year)-1)'}, Month =, Quarter = , date = >}FactSoldAmount) lines aren't shown together. At first I see sum of sales in 2017 from January to April, and then I see sum of sales in 2018 from January to April
- « Previous Replies
-
- 1
- 2
- Next Replies »
- Mark as New
- Bookmark
- Subscribe
- Mute
- Subscribe to RSS Feed
- Permalink
- Report Inappropriate Content
You can also create a field named DayYearNoYTD:
If( DayNumberOfYear(Today(1))>DayNumberOfYear(Date) , Dual(Date(Date,'MMM D'),DayNumberOfYear(Date)) , Null()) AS YearDayNoYTD
And then in your line chart turn off "Include Null Values" for the dimension DayYearNoYTD:
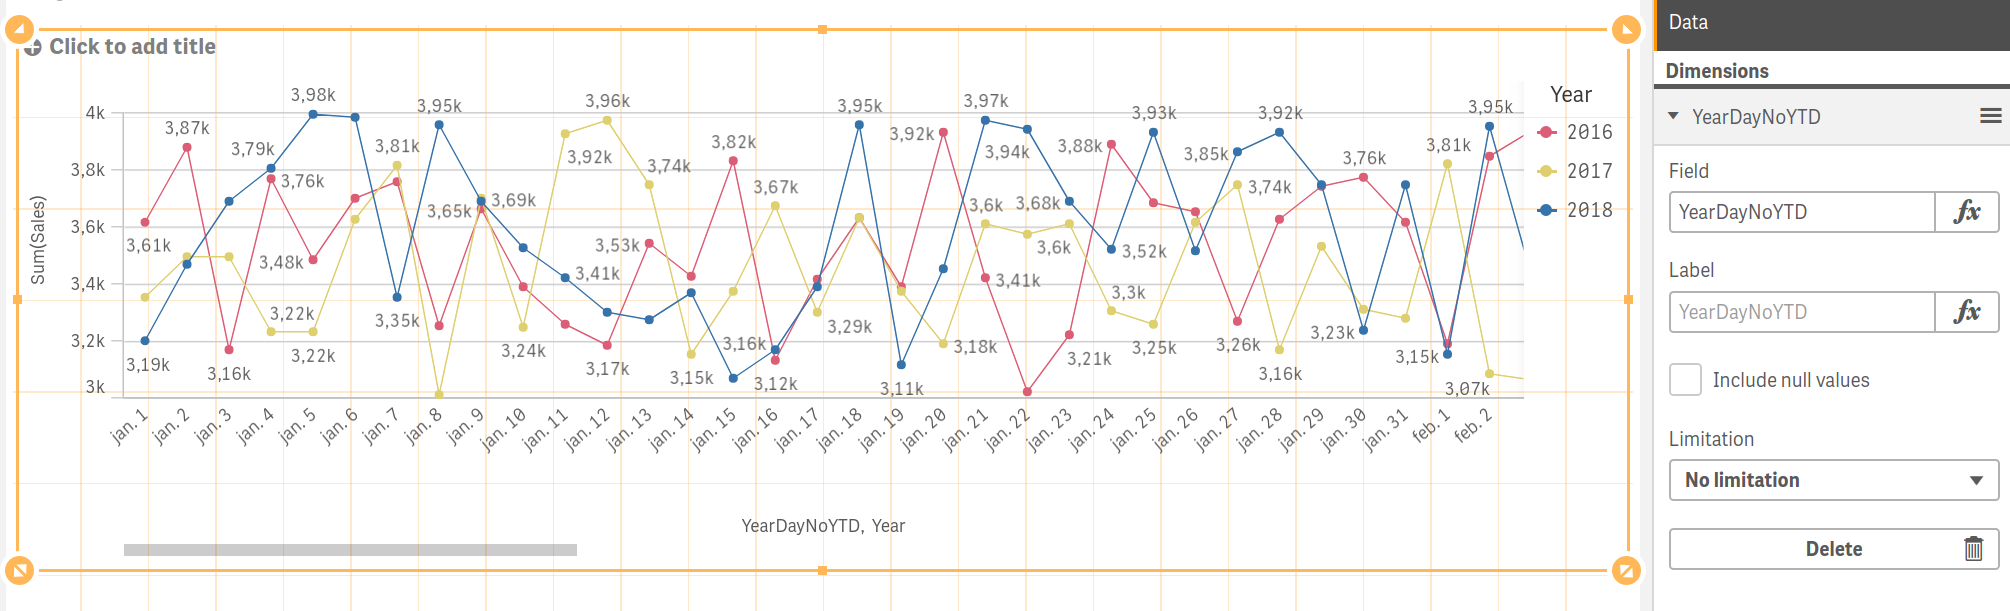
And then have simply Sum(Sales) as the expression
- « Previous Replies
-
- 1
- 2
- Next Replies »