Unlock a world of possibilities! Login now and discover the exclusive benefits awaiting you.
- Qlik Community
- :
- Forums
- :
- Analytics
- :
- New to Qlik Analytics
- :
- Need a chart based on Event Occurring Dates
- Subscribe to RSS Feed
- Mark Topic as New
- Mark Topic as Read
- Float this Topic for Current User
- Bookmark
- Subscribe
- Mute
- Printer Friendly Page
- Mark as New
- Bookmark
- Subscribe
- Mute
- Subscribe to RSS Feed
- Permalink
- Report Inappropriate Content
Need a chart based on Event Occurring Dates
Hi All,
***Solving in Qlik Sense***
I need guidance to solve a situation which I am trying to crack but not able to do so far.
Situation: I have some patients data in attached excel sheet, Starting from Enrolling into a therapy to delivery of Medicines s/he need to pass certain obstacles or Events in a particular order:
- Referral Received
- Insurance Investigation
- Authorization from Insurance Org
- Financial Assistance
- Nurse Training
Every event we calling it as Service Request which have a Start Date and an End Date (In case that activity is completed).
Problem I am trying to solve
- I am looking for a chart that will show me Dates on the X axis, Activity on Y axis
- I need to show Bars starting from the event start date (like a Gantt chart, I have looked in Qlik Branch but didn’t understand what they talking about and how to implement). E.G.
my first Event Starts on 1-Jan-17 and Ends on 15-Jan-17
Second Event starts on 16-Jan-17 to 15-Feb17
So chart will show Bar 1 for activity one till 15-Jan-17, Bar 2 from 16-Jan-17 to 14-Feb-17 and so on
Can someone please help me to crack this situation.
- Mark as New
- Bookmark
- Subscribe
- Mute
- Subscribe to RSS Feed
- Permalink
- Report Inappropriate Content
Hi Ankit,
As you said you want to display bars. For bar chart You need to give measure. And my question is what are you going to measure?
- Mark as New
- Bookmark
- Subscribe
- Mute
- Subscribe to RSS Feed
- Permalink
- Report Inappropriate Content
Well, no measure actually I need , I just want to represent how many events are there for a Person and which even Start when and ends when...
- Mark as New
- Bookmark
- Subscribe
- Mute
- Subscribe to RSS Feed
- Permalink
- Report Inappropriate Content
Hi Ankit,
I don't think it is possible to get bar chart with dimension in y axis.
Do you want something like this?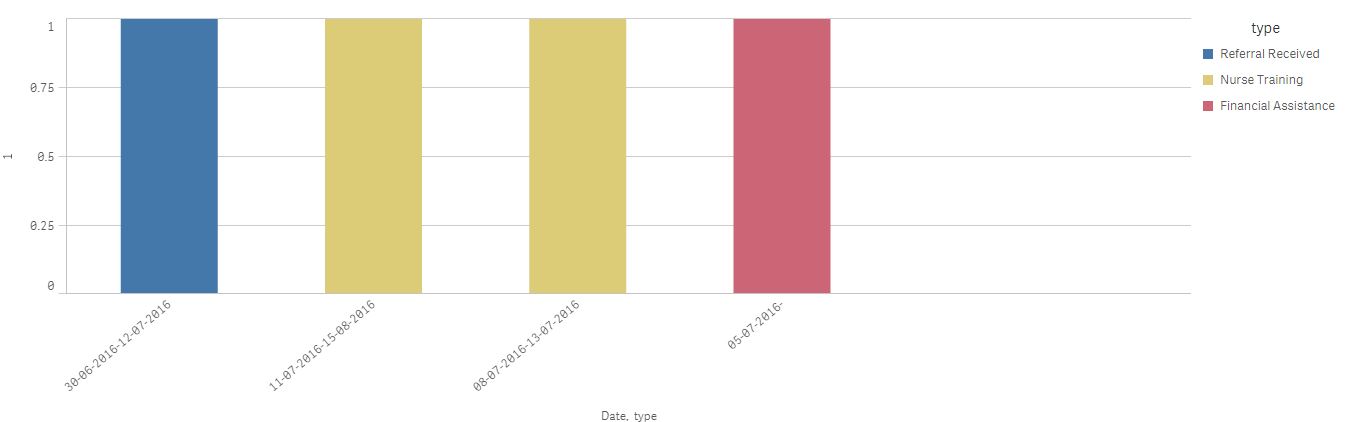
- Mark as New
- Bookmark
- Subscribe
- Mute
- Subscribe to RSS Feed
- Permalink
- Report Inappropriate Content
No actually not, I have loaded the Qlik Extension for timeline chart and stored in the Extension folder , but the Chart in the sheet not showing the New Chart based on extension, can you help whats wrong here?
I think if this solved, I will achieve what I am looking for.
- Mark as New
- Bookmark
- Subscribe
- Mute
- Subscribe to RSS Feed
- Permalink
- Report Inappropriate Content
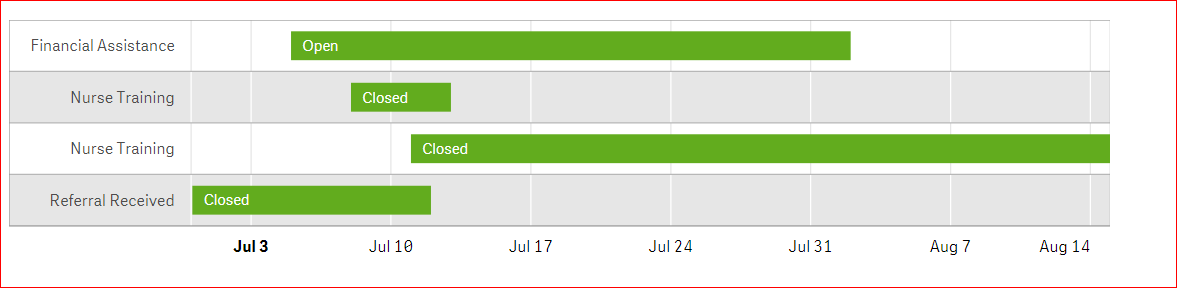
Hi Ankit
I have downloaded the extension Qlik Branch which i believed you have used.
Then i have created what i believe you are after.
One thing i noticed though is you have to have both a start and end date.
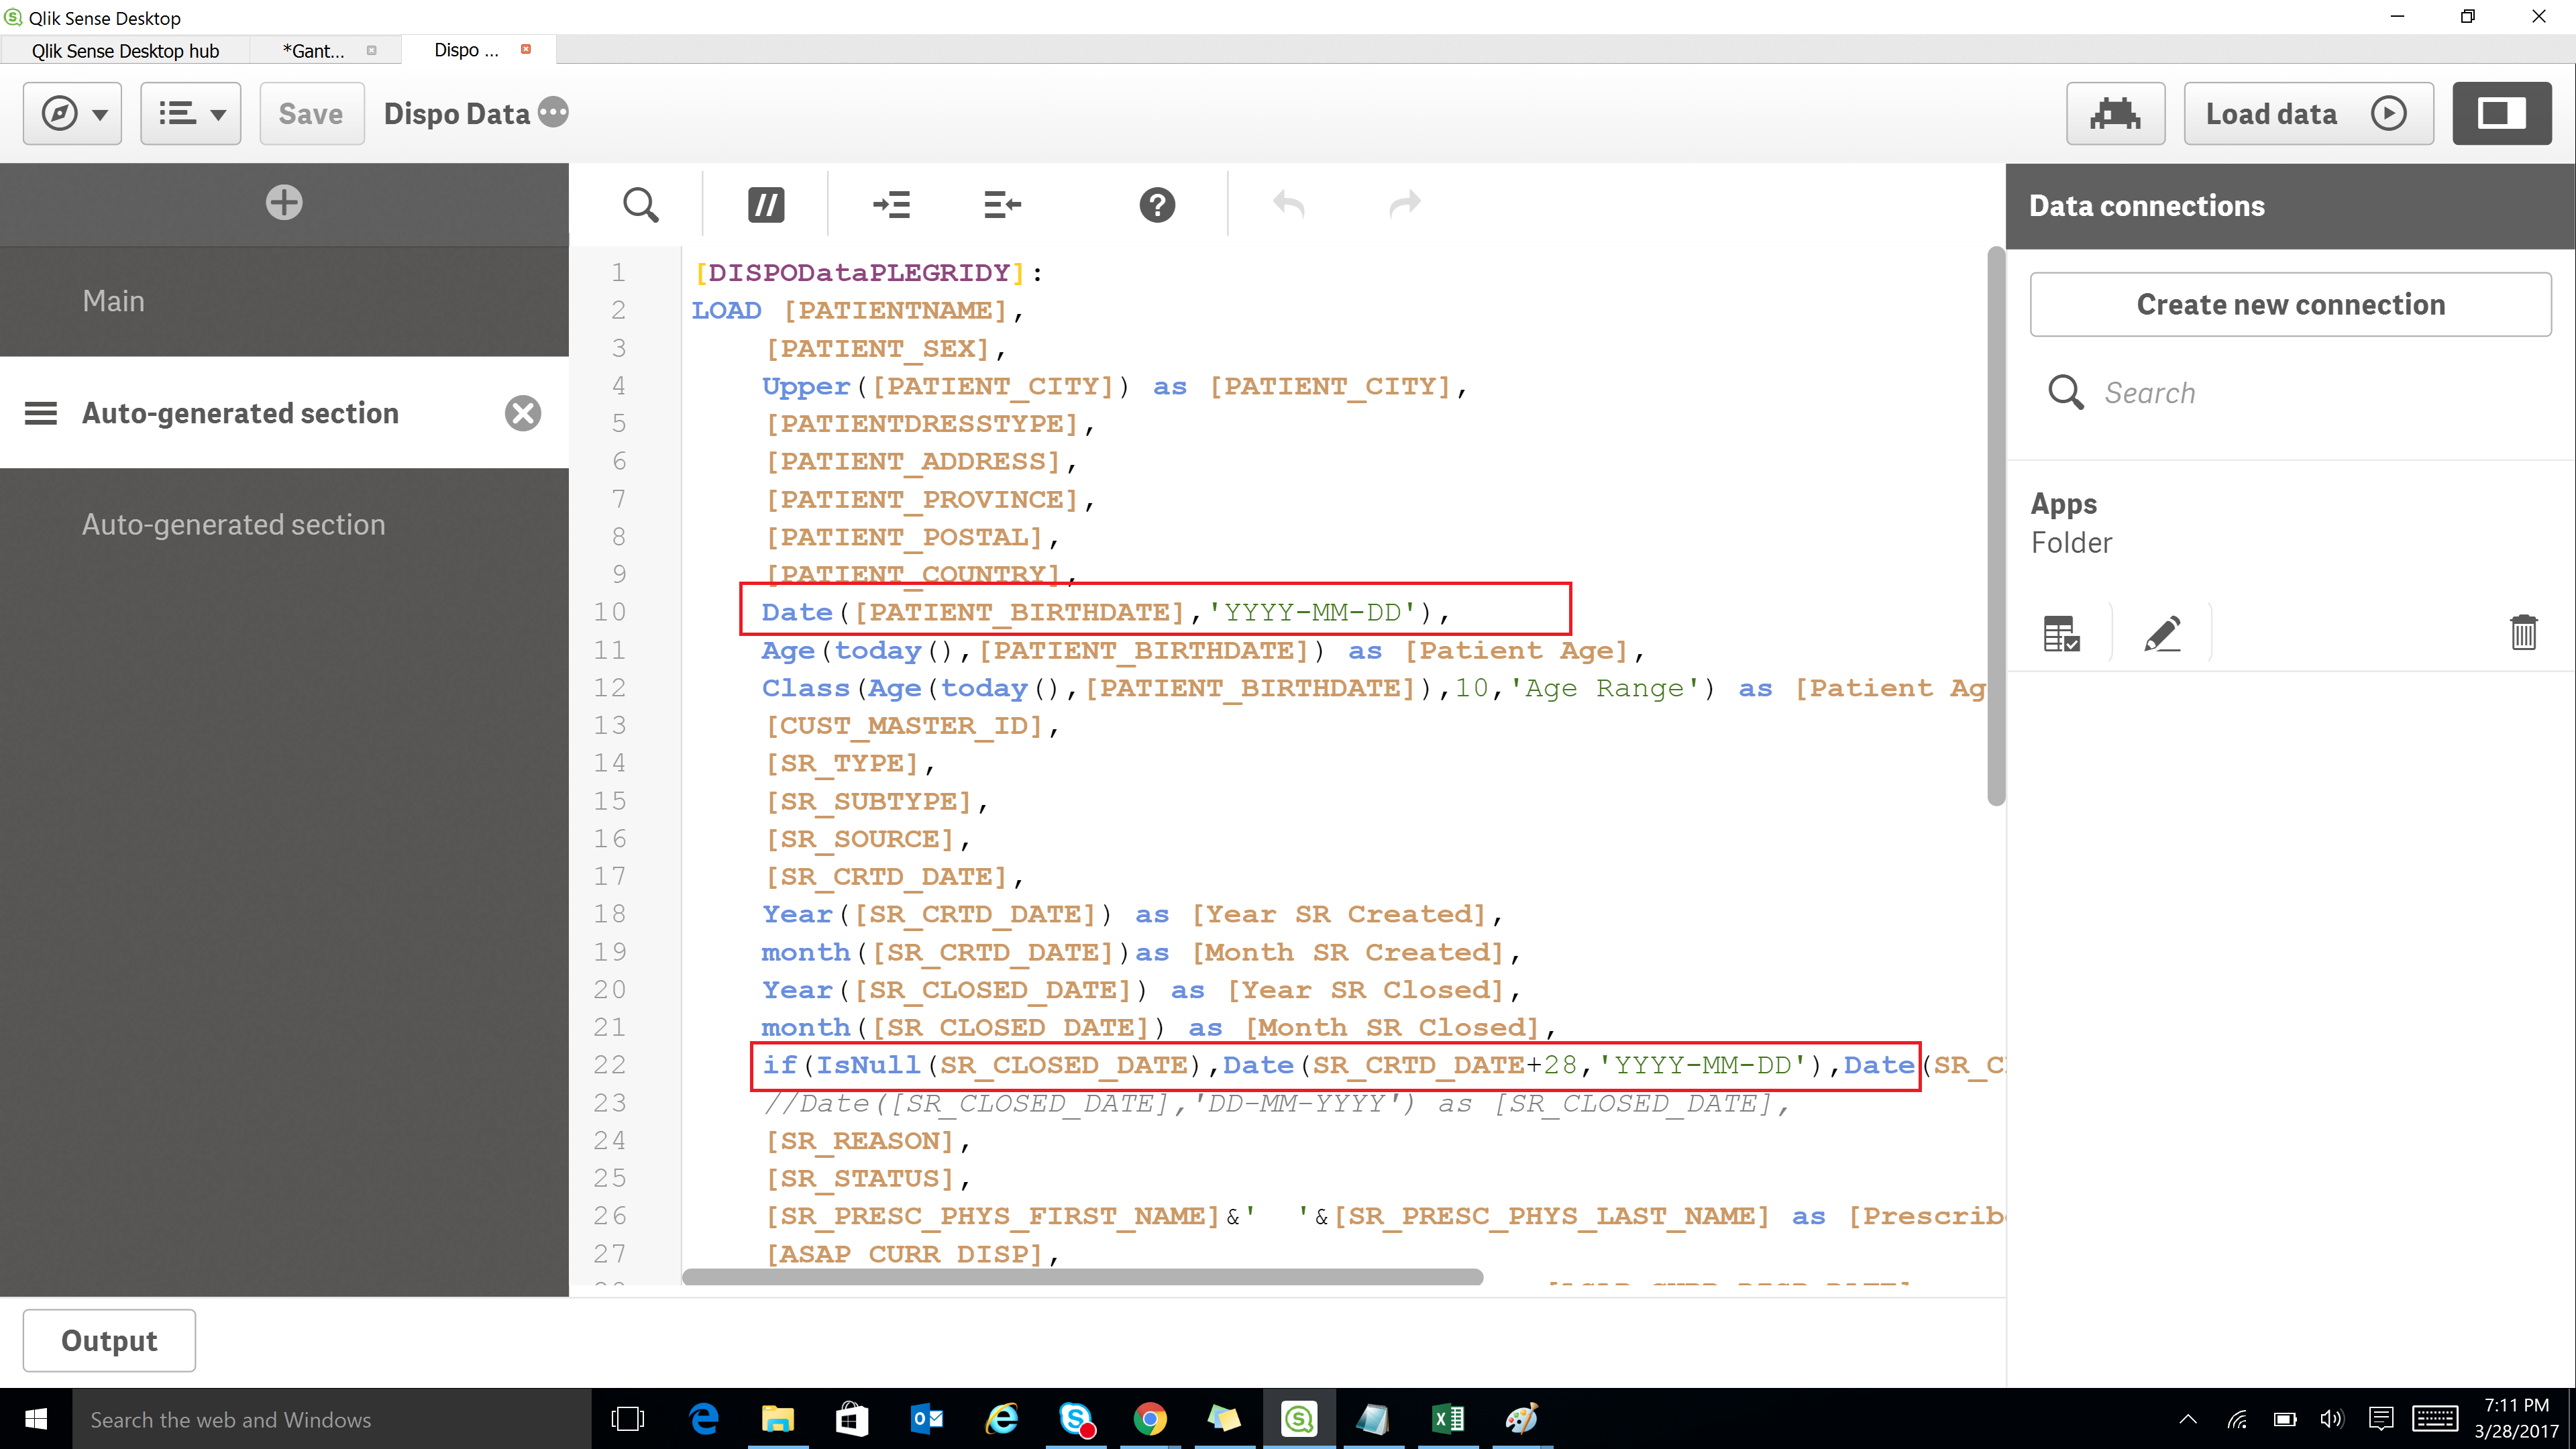
Therefore i have put a expression in the script to populate the null value
if(IsNull(SR_CLOSED_DATE),Date(SR_CRTD_DATE+28,'YYYY-MM-DD'),Date(SR_CLOSED_DATE,'YYYY-MM-DD')) as SR_CLOSED_DATE
See screenshot and attached app
Please mark as correct/helpful if this resolves your query
Thanks
Dan
- Mark as New
- Bookmark
- Subscribe
- Mute
- Subscribe to RSS Feed
- Permalink
- Report Inappropriate Content
Daniel, this is superb, I am trying to replicate the same with my code and getting blank row, attaching for your reference for guidance what wrong I am doing.
I am also attaching 3 screen shots:
Script 1: I have change the default Qlik Date format to YYYY-MM-DD
Script 2: My original data have Date of birth in format "DD-MMM-YY" I am converting it in code as :
Date([PATIENT_BIRTHDATE],'YYYY-MM-DD'),
Age(today(),[PATIENT_BIRTHDATE]) as [Patient Age],
Class(Age(today(),[PATIENT_BIRTHDATE]),10,'Age Range') as [Patient Age Group],
Script 3: Data Model Viewer, Post Step 1 and 2 I am seeing in Data model viewer, and where every I am converting Date in other format YYYY-MM-DD , data is not appearing.
Can u plz help.
Thx
Ankit
- Mark as New
- Bookmark
- Subscribe
- Mute
- Subscribe to RSS Feed
- Permalink
- Report Inappropriate Content
Daniel , one more thing, I want to club one more if in this statement and say if SR_Closed_Date>SR_CRTD_Date, then replace SR_Closed_Date with SR_CRTD_Date. Can we nest this in below statement?
if(IsNull(SR_CLOSED_DATE),Date(SR_CRTD_DATE+28,'YYYY-MM-DD'),Date(SR_CLOSED_DATE,'YYYY-MM-DD')) as SR_CLOSED_DATE,
SR_STATUS
Thx
Ankit
- Mark as New
- Bookmark
- Subscribe
- Mute
- Subscribe to RSS Feed
- Permalink
- Report Inappropriate Content
Daniel, I am through with Gantt Chart finally, thanks for your help, there are couple of things:
1. I am not getting Labels on the Bar like Open and close u have on chart , I am using the same Extension what u have , is there a trick?
2. I want to club one more if in this statement and say if SR_Closed_Date>SR_CRTD_Date, then replace SR_Closed_Date with SR_CRTD_Date. Can we nest this in below statement?
if(IsNull(SR_CLOSED_DATE),Date(SR_CRTD_DATE+28,'YYYY-MM-DD'),Date(SR_CLOSED_DATE,'YYYY-MM-DD')) as SR_CLOSED_DATE,
SR_STATUS
P.S: I have converted .CSV file in .xlsx and then the same code started working which not working whn I am uploading from .csv, not sure why it is like that.
Thx
Ankit