Unlock a world of possibilities! Login now and discover the exclusive benefits awaiting you.
- Qlik Community
- :
- Forums
- :
- Analytics
- :
- New to Qlik Analytics
- :
- Re: Percentages in barnhart with absolute numbers
- Subscribe to RSS Feed
- Mark Topic as New
- Mark Topic as Read
- Float this Topic for Current User
- Bookmark
- Subscribe
- Mute
- Printer Friendly Page
- Mark as New
- Bookmark
- Subscribe
- Mute
- Subscribe to RSS Feed
- Permalink
- Report Inappropriate Content
Percentages in barnhart with absolute numbers
Dear all,
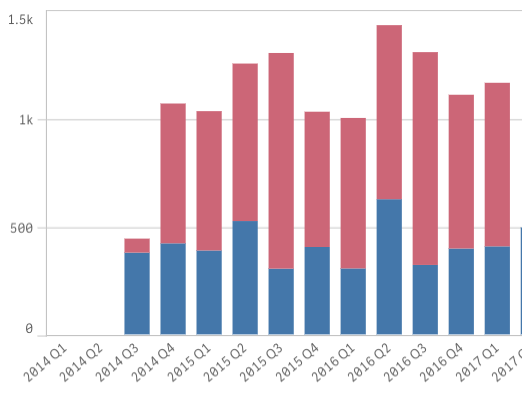
I now managed to get a barchart (attached below) based on the following:
Dimension
QuarterYear
Measures
sum({<Customer={ABC}>}[Revenue])
=Sum([Revenue])-sum({<VCustomer={ABC}>}[Revenue])
I would now want to display percentages(the share for ABC on the total revenue) in addition to the total $$$.
Possible? If so: doable for a beginner?
Thanks for your advise, help, support,
Florian
- Mark as New
- Bookmark
- Subscribe
- Mute
- Subscribe to RSS Feed
- Permalink
- Report Inappropriate Content
Expression Tab-
Add one more expression in the chart for percentage you are looking for
Uncheck display option>bar
Check> values on data points
Number Tab-
Number format> check show in percent(%)
This will just add the value on the chart but not the bar.
- Mark as New
- Bookmark
- Subscribe
- Mute
- Subscribe to RSS Feed
- Permalink
- Report Inappropriate Content
Dear Ash,
I did add the expression as you perfectly described.
However it seems I do not have the functionalities available you describe - I work online and it seems I do not have those options - or I am simply not capable of QS at all..?
All it does so far is to display the total sum of each bar but nothing for the "Customer" part.
lost and a bit frustrated since most likely your answer is the one, I simply cannot find the checkboxes...
Any thoughts anybody?
Florian
- Mark as New
- Bookmark
- Subscribe
- Mute
- Subscribe to RSS Feed
- Permalink
- Report Inappropriate Content
Dear all,
the solution proposed so far does not work on QlikSense - as far as I know it did work in QlikView.
So I am looking to add % to a bar chart in QlikSENSE, any ideas/solutions?
Thanks a lot,
Florian
- Mark as New
- Bookmark
- Subscribe
- Mute
- Subscribe to RSS Feed
- Permalink
- Report Inappropriate Content
You can use combo chart where you can show revenue sum for customer ABC on one axis and % of Revenue For that customer ABC on other axis.
Expressions will be
sum({<Customer={ABC}>}[Revenue])
and
sum(Total Revenue)-sum({<Customer={ABC}>}[Revenue])
In the presentation select to show 2nd expression on 2nd axis.
- Mark as New
- Bookmark
- Subscribe
- Mute
- Subscribe to RSS Feed
- Permalink
- Report Inappropriate Content
I thought it is in Qlikview.. Sorry!
I think you would want to add one more expression. But I am not Qliksense expert 
- Mark as New
- Bookmark
- Subscribe
- Mute
- Subscribe to RSS Feed
- Permalink
- Report Inappropriate Content
You can use sum({<Customer={ABC}>}[Revenue])/sum({<Customer={ABC}>}TOTAL [Revenue])
- Mark as New
- Bookmark
- Subscribe
- Mute
- Subscribe to RSS Feed
- Permalink
- Report Inappropriate Content
Dear Ash,
I probably did not make that very clear and highly appreciate your support and time, seriously! It seems some things that worked in QlikView do not (yet?) work in QlikSense, at least no solution yet 😞
Thanks again,
Florian
- Mark as New
- Bookmark
- Subscribe
- Mute
- Subscribe to RSS Feed
- Permalink
- Report Inappropriate Content
Dear Gonna,
thanks a lot for sharing the formula! My challenge now is to make the actual number visible when I also show the total market size - seems one cannot display two figures?
Florian
- Mark as New
- Bookmark
- Subscribe
- Mute
- Subscribe to RSS Feed
- Permalink
- Report Inappropriate Content
I think only one value per bar is displayed if the measures are displayed as a stacked bar.
Try the Barchart extension in branch Qlik Branch