Unlock a world of possibilities! Login now and discover the exclusive benefits awaiting you.
- Qlik Community
- :
- Forums
- :
- Analytics
- :
- New to Qlik Analytics
- :
- Pivot Table - Background Colour by Expression
- Subscribe to RSS Feed
- Mark Topic as New
- Mark Topic as Read
- Float this Topic for Current User
- Bookmark
- Subscribe
- Mute
- Printer Friendly Page
- Mark as New
- Bookmark
- Subscribe
- Mute
- Subscribe to RSS Feed
- Permalink
- Report Inappropriate Content
Pivot Table - Background Colour by Expression
Hi All,
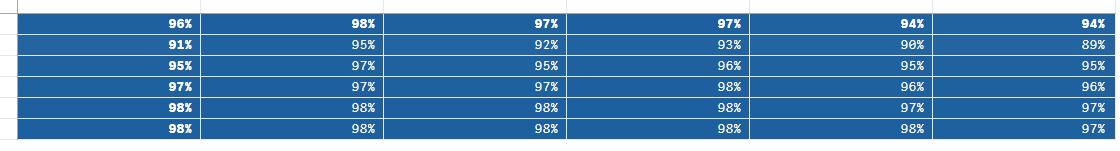
I am trying to create a conditionally formatted pivot table. I am trying to use the colormix2 function in the Background color expression box to create the conditional formatting, however it is only throwing one color out.
ColorMix2((Count(DISTINCT {<status={'1'}>} UNIQUE_ID)/
Count(DISTINCT UNIQUE_ID)) , rgb(180,212,218), rgb(28,95,158))
Has anyone any ideas how I could modify this code in order to have 4 distinct colors based on the min to max values in the table?
Regards
Finbar
- « Previous Replies
-
- 1
- 2
- Next Replies »
- Mark as New
- Bookmark
- Subscribe
- Mute
- Subscribe to RSS Feed
- Permalink
- Report Inappropriate Content
Hi harish.insights,
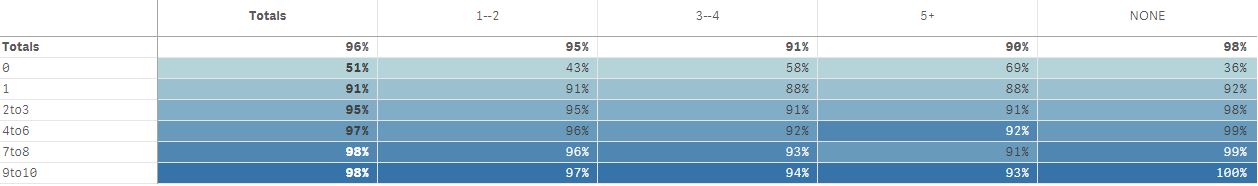
That works to a point. It creates the background colour expression based on numbers are in that row.
Is there anyway the code can be changed so that it takes in consideration the full table?
Also do you know how to include the totals?
- Mark as New
- Bookmark
- Subscribe
- Mute
- Subscribe to RSS Feed
- Permalink
- Report Inappropriate Content
Except the dimension, you can set background color including totals as well.
hope this helps,
Colormix1((EXPRESSION-$(=min(aggr( EXPRESSION, DIMENSION))))/$(=(max(aggr( EXPRESSION,DIMENSION)) -min(aggr( EXPRESSION, DIMENSION)))),white(),LightGreen())
- « Previous Replies
-
- 1
- 2
- Next Replies »