Unlock a world of possibilities! Login now and discover the exclusive benefits awaiting you.
- Qlik Community
- :
- Forums
- :
- Analytics
- :
- New to Qlik Analytics
- :
- Re: Pivot Table Filter on Column
- Subscribe to RSS Feed
- Mark Topic as New
- Mark Topic as Read
- Float this Topic for Current User
- Bookmark
- Subscribe
- Mute
- Printer Friendly Page
- Mark as New
- Bookmark
- Subscribe
- Mute
- Subscribe to RSS Feed
- Permalink
- Report Inappropriate Content
Pivot Table Filter on Column
I would like to do the following in Qlik Sense. I am wondering if there is a way to do it using a pivot table. Alternatively, I can produce a straight table, and do the same operation. But I'd prefer to use pivot table to do it. Thanks!
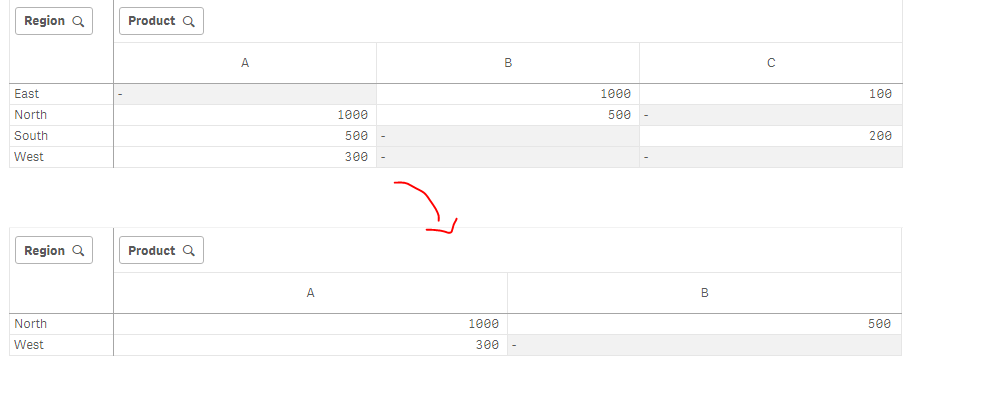
I created a pivot table using like table 1
Table 1
| |||||||||||||||||||||
Now I want to filter on product C so that only show rows where sales for C is greater than 0. I want the product selection to be user defined. i.e. If the user select product A, then we would filter on A using the same condition.
Table 2
| |||||||||||||
- « Previous Replies
-
- 1
- 2
- Next Replies »
- Mark as New
- Bookmark
- Subscribe
- Mute
- Subscribe to RSS Feed
- Permalink
- Report Inappropriate Content
If I understood you correctly, my original data is "organised" with one product column and a value column (sales). What I am showing in the original post is a pivot table I created in Qlik Sense based on the original data. The structure of the original data is like the following:
| Client ID | Region | Product | Sales |
| 1 | North | A | 1000 |
| 2 | North | B | 500 |
| 3 | East | C | 100 |
| 4 | East | B | 1000 |
| 5 | Sourth | A | 500 |
| 6 | Sourth | C | 200 |
| 7 | West | A | 300 |
- Mark as New
- Bookmark
- Subscribe
- Mute
- Subscribe to RSS Feed
- Permalink
- Report Inappropriate Content
Not exact number as shown in the original post, but this shows the structure.
| Client ID | Region | Product | Sales |
| 1 | North | A | 1000 |
| 2 | North | B | 500 |
| 3 | East | C | 100 |
| 4 | East | B | 1000 |
| 5 | South | A | 500 |
| 6 | South | C | 200 |
| 7 | West | A | 300 |
- Mark as New
- Bookmark
- Subscribe
- Mute
- Subscribe to RSS Feed
- Permalink
- Report Inappropriate Content
no need for the crosstable load so; just do as I've told u at first and tell me what happens
- Mark as New
- Bookmark
- Subscribe
- Mute
- Subscribe to RSS Feed
- Permalink
- Report Inappropriate Content
May be this:
Sum({<Product={"=Sum(Sales)>0"},Region={"$(=GetFieldSelections(Region))"}>}Sales)
Here we have to filters that will be done:
Region and Product
Farol BI
WhatsApp: 24 98152-1675
Skype: justen.thiago
- Mark as New
- Bookmark
- Subscribe
- Mute
- Subscribe to RSS Feed
- Permalink
- Report Inappropriate Content
Here is the result:
Farol BI
WhatsApp: 24 98152-1675
Skype: justen.thiago
- Mark as New
- Bookmark
- Subscribe
- Mute
- Subscribe to RSS Feed
- Permalink
- Report Inappropriate Content
Sum({<Region={'North','West'}>}Sales)
result:
- « Previous Replies
-
- 1
- 2
- Next Replies »