Unlock a world of possibilities! Login now and discover the exclusive benefits awaiting you.
- Qlik Community
- :
- Forums
- :
- Analytics
- :
- New to Qlik Analytics
- :
- Pivot Table with 1 Dimension and many measures
- Subscribe to RSS Feed
- Mark Topic as New
- Mark Topic as Read
- Float this Topic for Current User
- Bookmark
- Subscribe
- Mute
- Printer Friendly Page
- Mark as New
- Bookmark
- Subscribe
- Mute
- Subscribe to RSS Feed
- Permalink
- Report Inappropriate Content
Pivot Table with 1 Dimension and many measures
Hi Guys,
in my report, I want to create report with 1 dimension and many measures from my stock card.
Example :
Measures jan Feb Mar Apr ....
Beginning of Stock
Received
Qty Sold
Retur
Exchange
Adjustment
Reject
Sample
etc.
I can't do it since table in QS measures in coloumn.
PLease advice.
Thanks
Henry
- « Previous Replies
-
- 1
- 2
- Next Replies »
- Mark as New
- Bookmark
- Subscribe
- Mute
- Subscribe to RSS Feed
- Permalink
- Report Inappropriate Content
A crosstable-pivot with a horizontal month-dimension and vertical measures are possible then in a pivot you could drag and drop dimensions and measures like you wished horizontal and vertical.
- Marcus
- Mark as New
- Bookmark
- Subscribe
- Mute
- Subscribe to RSS Feed
- Permalink
- Report Inappropriate Content
I am using JS pivot table extension, and there are 2 dimension and only 1 measure.
is there any pivot table extension which can many measures and 1 dimension ?

- Mark as New
- Bookmark
- Subscribe
- Mute
- Subscribe to RSS Feed
- Permalink
- Report Inappropriate Content
Use simply a normal pivot-chart.
- Marcus
- Mark as New
- Bookmark
- Subscribe
- Mute
- Subscribe to RSS Feed
- Permalink
- Report Inappropriate Content
Hi Henry,
I had a similar problem an maybe it is your solution ,
You can check http://community.qlik.com/message/700832?et=watches.email.thread#700832
Regards,
Albert
- Mark as New
- Bookmark
- Subscribe
- Mute
- Subscribe to RSS Feed
- Permalink
- Report Inappropriate Content
Hi
You have to write a single expression with multiple if conditions like
Dimensions : Measures, Month
Expression :
=If(Measure = 'Beginning of Stock', Sum([Beginning of Stock]),
If(Measure = 'Received', Sum([Received]),
If(Measure = 'Qty Sold', Sum([Qty Sold]),
...............................................
...............................................
))))) (This is an example expression, you have to create your expression like this depends upon the number of measure you have)
Hope it helps you..
-- Ravikumar
- Mark as New
- Bookmark
- Subscribe
- Mute
- Subscribe to RSS Feed
- Permalink
- Report Inappropriate Content
Hi Marcus,
Sorry I dont understand, normal pivot chart, is it bar chart n QS or another extension.
Because I cannot find that feature.
I just try with KFTable extension but also cannot solve my problem.
- Mark as New
- Bookmark
- Subscribe
- Mute
- Subscribe to RSS Feed
- Permalink
- Report Inappropriate Content
Hi Ravi,
Thanks for your reply,
Anyway I am not expert to create expression. 
in my database, Beginning of stock, received are not in the same column, different table.
and when I am trying to write Measure and get error.
Could you please more spesific for this one ?
thanks a lot
- Mark as New
- Bookmark
- Subscribe
- Mute
- Subscribe to RSS Feed
- Permalink
- Report Inappropriate Content
this is exactly that I need

- Mark as New
- Bookmark
- Subscribe
- Mute
- Subscribe to RSS Feed
- Permalink
- Report Inappropriate Content
Hi,
No problem , if you don't have measures in a single column then create a dummy column as below with sample data
Step 1:
A:
Load * Inline [
Katalok Short Name, QtySold, Reject, SalesHK, StockAwal
Kat 17, 10, 5, 100, 50
Kat 18, 15, 10, 500, 30
Kat 19, 20, 5, 1000, 50
Kat 20, 50, 45, 200, 100
];
Set vHidePrefix = _;
DummyTable:
Load * Inline [
_Dimension
QtySold
Reject
SalesHK
StockAwal
];
Step 2:
In a pivot table Use,
Dimensions : _Dimension, [Katalok Short Name]
Expression :
=If(_Dimension='QtySold', Sum(QtySold),
If(_Dimension='Reject', Sum(Reject),
If(_Dimension='SalesHK', Sum(SalesHK),
If(_Dimension='StockAwal', Sum(StockAwal)
))))
Step 3:
This could be your chart
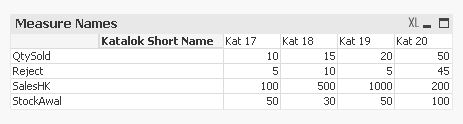
Note: Please do modifications accordingly as per the data you have.
Hope this is what you are looking for ..
-- Ravikumar
- « Previous Replies
-
- 1
- 2
- Next Replies »