Unlock a world of possibilities! Login now and discover the exclusive benefits awaiting you.
- Qlik Community
- :
- Forums
- :
- Analytics
- :
- New to Qlik Analytics
- :
- Pivot Table with Dimensions and Measures and Inlin...
- Subscribe to RSS Feed
- Mark Topic as New
- Mark Topic as Read
- Float this Topic for Current User
- Bookmark
- Subscribe
- Mute
- Printer Friendly Page
- Mark as New
- Bookmark
- Subscribe
- Mute
- Subscribe to RSS Feed
- Permalink
- Report Inappropriate Content
Pivot Table with Dimensions and Measures and Inline
Hi All,
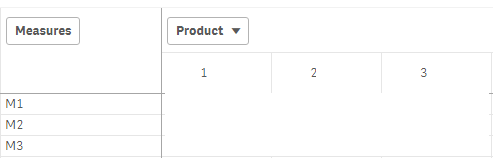
We have a Pivot table like -
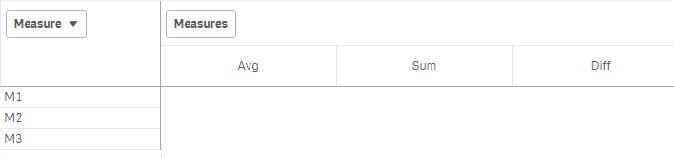
We have another similar table, which looks like -
Now in first image, Product is a Dimension whereas, M1, M2, M3 are calculated measures.
In second table, we have Measure M1, M2, M3 as Inline load, and using pick match function we are calculating Avg, Sum and Diff.
Any idea regarding, how we can combine both the tables.
Regards,
MK
- Mark as New
- Bookmark
- Subscribe
- Mute
- Subscribe to RSS Feed
- Permalink
- Report Inappropriate Content
Can you upload a example app?
And perhabs descripe a little bit more exact?
Are the Data connected?
What exact want you see in a combined table?
- Mark as New
- Bookmark
- Subscribe
- Mute
- Subscribe to RSS Feed
- Permalink
- Report Inappropriate Content
Hi Mrudul K
Try mixing in the "Valuelist" funktion for Dim and Expr.
I dont fully understrand the requirement either.
ValueList - chart function ‒ Qlik Sense
/Teis