Unlock a world of possibilities! Login now and discover the exclusive benefits awaiting you.
- Qlik Community
- :
- Forums
- :
- Analytics
- :
- New to Qlik Analytics
- :
- Re: Previous month vs Current Month in Qlik sense
- Subscribe to RSS Feed
- Mark Topic as New
- Mark Topic as Read
- Float this Topic for Current User
- Bookmark
- Subscribe
- Mute
- Printer Friendly Page
- Mark as New
- Bookmark
- Subscribe
- Mute
- Subscribe to RSS Feed
- Permalink
- Report Inappropriate Content
Previous month vs Current Month in Qlik sense
Hi Qlikers,
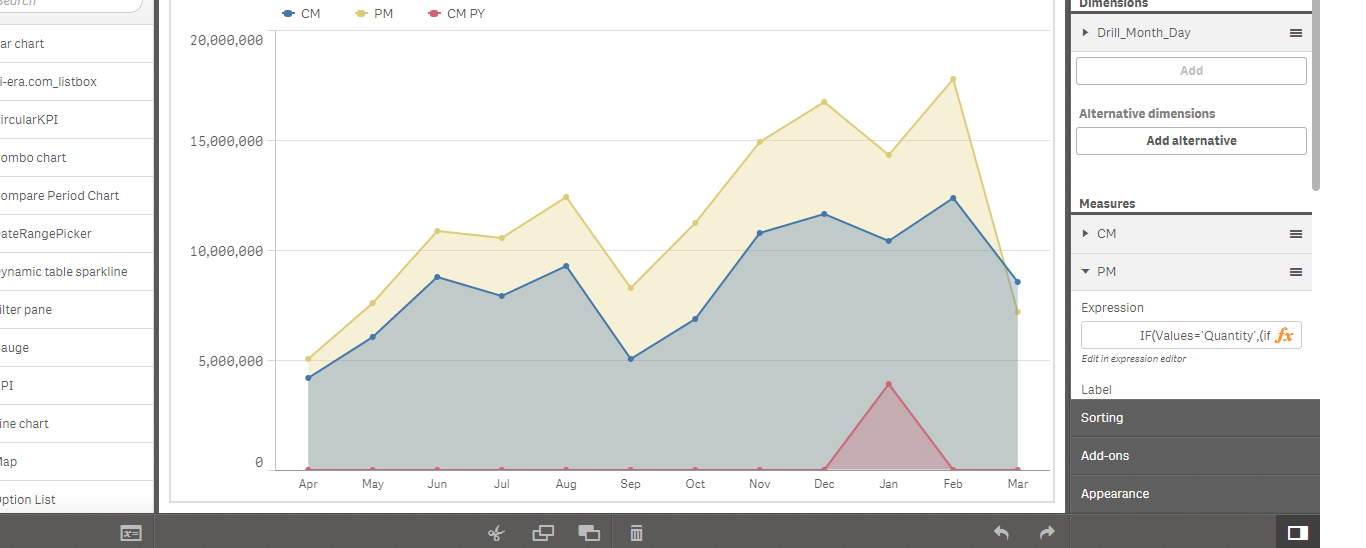
I wanted to show line Chart for Previous month and current month for dimension :Month-> Day
Expression for current month
=sum({<type={'Order'},FiscalYear={$(=max(FiscalYear))}>} Sales)
Current Month works fine
Expression for Previous month
=sum({<type={'Order'},FiscalYear={$(=max(FiscalYear))},MonthID={$(=max(MonthID)-1)}>} Sales)
It Showing Wrong output
Can anyone help me?
- « Previous Replies
-
- 1
- 2
- Next Replies »
- Mark as New
- Bookmark
- Subscribe
- Mute
- Subscribe to RSS Feed
- Permalink
- Report Inappropriate Content
If you have Month as Dimension, then you have to keep in mind that in QlikView Set Analysis, Set Expression will evaluate once only per chart..
- Mark as New
- Bookmark
- Subscribe
- Mute
- Subscribe to RSS Feed
- Permalink
- Report Inappropriate Content
Don't you think, Current month should like this?
sum({<type={'Order'},FiscalYear={"$(=max(FiscalYear))"},MonthID={"$(=max(MonthID))"}>} Sales)
- Mark as New
- Bookmark
- Subscribe
- Mute
- Subscribe to RSS Feed
- Permalink
- Report Inappropriate Content
for previous try this
=above(sum({<type={'Order'},FiscalYear={"$(=max(FiscalYear))"}>} Sales),0,rowno())
- Mark as New
- Bookmark
- Subscribe
- Mute
- Subscribe to RSS Feed
- Permalink
- Report Inappropriate Content
Thank you Kushal Chawda
Sorry it didn't work
- Mark as New
- Bookmark
- Subscribe
- Mute
- Subscribe to RSS Feed
- Permalink
- Report Inappropriate Content
Would you be able to share a sample?
- Mark as New
- Bookmark
- Subscribe
- Mute
- Subscribe to RSS Feed
- Permalink
- Report Inappropriate Content
It may be look like it

- Mark as New
- Bookmark
- Subscribe
- Mute
- Subscribe to RSS Feed
- Permalink
- Report Inappropriate Content
Better u can use "above" function to get the data's of previous month.
- Mark as New
- Bookmark
- Subscribe
- Mute
- Subscribe to RSS Feed
- Permalink
- Report Inappropriate Content
Hi,
Use above function : (above(sum({<type={'Order'},FiscalYear={"$(=max(FiscalYear))"}>} Sales))
and set previous year max month in the variable then use that variable in null values in the column.
- Mark as New
- Bookmark
- Subscribe
- Mute
- Subscribe to RSS Feed
- Permalink
- Report Inappropriate Content
Hi Scotly,
In our master calendar, make use of inMonth() and InMonthToDate() function to set flags and make use of these flags in set analysis.
This will even improve the performance.
Thanks,
Sangram.
- « Previous Replies
-
- 1
- 2
- Next Replies »