Unlock a world of possibilities! Login now and discover the exclusive benefits awaiting you.
- Qlik Community
- :
- Forums
- :
- Analytics
- :
- New to Qlik Analytics
- :
- Restrict Line Chart Till the Month where value is ...
- Subscribe to RSS Feed
- Mark Topic as New
- Mark Topic as Read
- Float this Topic for Current User
- Bookmark
- Subscribe
- Mute
- Printer Friendly Page
- Mark as New
- Bookmark
- Subscribe
- Mute
- Subscribe to RSS Feed
- Permalink
- Report Inappropriate Content
Restrict Line Chart Till the Month where value is available
Hello!
I have used a combo chart showing Budget, Last year and current year values. I don't want to show values for months that haven't happened yet and want the line chart to stop at March. Attached is an image (Chart 1) showing the same. Please let me know how this can achieved and if there is an expression that can be added to the specific measure in order to get the desired result.
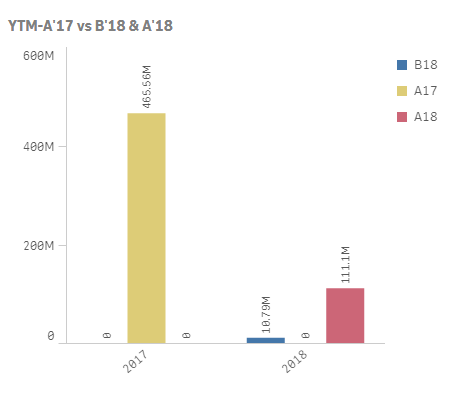
Secondly, I have a bar chart where I have added the following expression =if([Year]='2017'or [Year]='2018',[Year]) in dimensions, so that values for only these 2 years and 2018 Budget are shown. However, I see 0 values which keep showing up in between the bars. Attached is the image (Chart 2).
Please let me know how I can fix these issues.
Thanks,
Rony
- « Previous Replies
- Next Replies »
- Mark as New
- Bookmark
- Subscribe
- Mute
- Subscribe to RSS Feed
- Permalink
- Report Inappropriate Content
Yes. But that option is not showing up here. 
- « Previous Replies
- Next Replies »