Unlock a world of possibilities! Login now and discover the exclusive benefits awaiting you.
- Qlik Community
- :
- Forums
- :
- Analytics
- :
- New to Qlik Analytics
- :
- Rolling 12Months for Sales in Bar Chart
- Subscribe to RSS Feed
- Mark Topic as New
- Mark Topic as Read
- Float this Topic for Current User
- Bookmark
- Subscribe
- Mute
- Printer Friendly Page
- Mark as New
- Bookmark
- Subscribe
- Mute
- Subscribe to RSS Feed
- Permalink
- Report Inappropriate Content
Rolling 12Months for Sales in Bar Chart
Hello Team,
I am trying to show only last 12 months Total_Expense measure value in bar chart... X-Axis = YYYYMM & Y-Axis= Sum of Total Expense.
I am using Sum(TOTAL_EXPENSE) expression in measure value..
Format is YYYYMM, which data used to.
Can any one help me find out expression which i can use for last 12 rolling months in the bar chart..
- Mark as New
- Bookmark
- Subscribe
- Mute
- Subscribe to RSS Feed
- Permalink
- Report Inappropriate Content
Sum( {<YYYYMM={">=$(=AddMonths(Max(Date(Date#(YYYYMM,'YYYYMM'),'YYYYMM')),-12))<=$(=Max(Date(Date#(YYYYMM,'YYYYMM'),'YYYYMM')))"}>} TOTAL_EXPENSE)
PS: Make sure you use the correct field name (maybe it is not named like YYYYMM)
- Mark as New
- Bookmark
- Subscribe
- Mute
- Subscribe to RSS Feed
- Permalink
- Report Inappropriate Content
I am limiting last 12 months only...
X-Axis(Dimension) = CLAIM_YEARMONTH - Format like YYYYMM (Eg: 201701, 201702,.. 201707 .. 201712, 201801, 201802)
Y-Axis(Measure) = TOTAL_EXPENSES - $
in
If is format case, how to set my yearmonth analysis? Becuase there is no date available in the data.. All data's pretending by year & month.. Like YYYYMM
- Mark as New
- Bookmark
- Subscribe
- Mute
- Subscribe to RSS Feed
- Permalink
- Report Inappropriate Content
Sum( {<YYYYMM={">=$(=AddMonths(Max(Date(Date#(CLAIM_YEARMONTH,'YYYYMM'),'YYYYMM')),-12))<=$(=Max(Date(Date#(CLAIM_YEARMONTH,'YYYYMM'),'YYYYMM')))"}>} TOTAL_EXPENSE)
- Mark as New
- Bookmark
- Subscribe
- Mute
- Subscribe to RSS Feed
- Permalink
- Report Inappropriate Content
You will therefore be wanting something like this in the expression:
Sum( {<CLAIM_YEARMONTH={">=$(=Date(AddMonths(Max(CLAIM_YEARMONTH),-12),'YYYYMM')"}>} TOTAL_EXPENSES)
Steve
- Mark as New
- Bookmark
- Subscribe
- Mute
- Subscribe to RSS Feed
- Permalink
- Report Inappropriate Content
{">=$(=Date(AddMonths(Max(CLAIM_YEARMONTH),-12),'YYYYMM')"}>}
Why these are in Green color...? while pasting in Expression....
i think i need to make set format for yearmonth like "YYYYMM"? If yes, how should i do it?
- Mark as New
- Bookmark
- Subscribe
- Mute
- Subscribe to RSS Feed
- Permalink
- Report Inappropriate Content
My bad,
like steve dark said it will be this:
Sum( {<CLAIM_YEARMONTH={">=$(=AddMonths(Max(Date(Date#(CLAIM_YEARMONTH,'YYYYMM'),'YYYYMM')),-12))<=$(=Max(Date(Date#(CLAIM_YEARMONTH,'YYYYMM'),'YYYYMM')))"}>} TOTAL_EXPENSE)
- Mark as New
- Bookmark
- Subscribe
- Mute
- Subscribe to RSS Feed
- Permalink
- Report Inappropriate Content
No Youssef... Again its showing all the months... not limiting to last 12 months...
- Mark as New
- Bookmark
- Subscribe
- Mute
- Subscribe to RSS Feed
- Permalink
- Report Inappropriate Content
Note you have referred to both TOTAL_EXPENSE and TOTAL_EXPENSES, you will need to use the right name.
It's green because it is set analysis, this is just how Sense formats set analysis.
If CLAIM_YEARMONTH is not actually a date field, rather it's a string or a number, then it will need to be treated differently.
If you create a Filter Pane with CLAIM_YEARMONTH, does it align to the right or the left?
You may be able to get the expression to work with the following:
Sum( {<CLAIM_YEARMONTH={">=$(=Max(CLAIM_YEARMONTH)-100)"}>} TOTAL_EXPENSES)
The best thing to do is to test and then build up, for example, does this work:
Sum( {<CLAIM_YEARMONTH={">=201703"}>} TOTAL_EXPENSES)
If so, we just need to get the date value to work correctly. Next create a text box and check the contents of the variable (the bit inside the $() ) to work, add the following as a measure:
=Max(CLAIM_YEARMONTH)-100
Check whether that returns the month you are expecting.
It will be far better to format the date properly on load (using Date and Date#) but treating the date as an integer should work.
Steve
- Mark as New
- Bookmark
- Subscribe
- Mute
- Subscribe to RSS Feed
- Permalink
- Report Inappropriate Content
would you be able to attach some data here ? at least more than 12 rows corresponding to year using a YYYYMM field
- Mark as New
- Bookmark
- Subscribe
- Mute
- Subscribe to RSS Feed
- Permalink
- Report Inappropriate Content
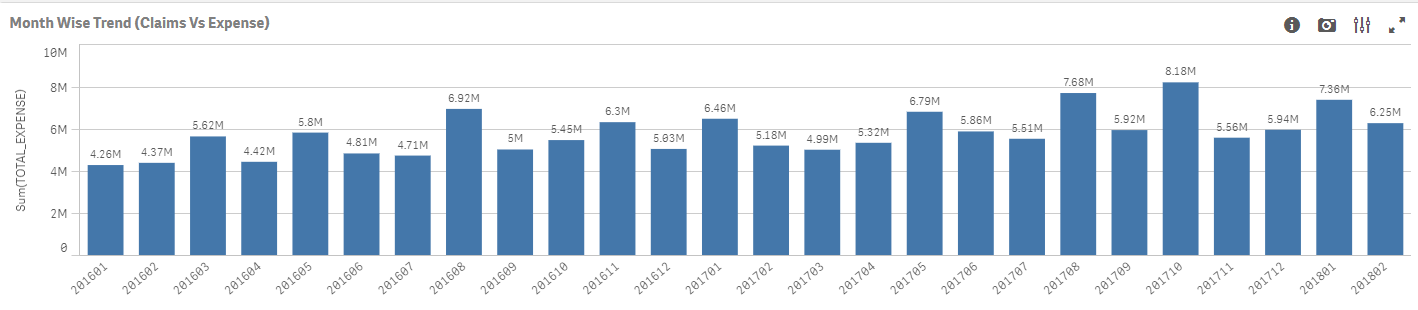
Here i attached raw data which 201601 to 201802... But i need to show last 12 rolling months... Eg: 201703 to 201802...