Unlock a world of possibilities! Login now and discover the exclusive benefits awaiting you.
- Qlik Community
- :
- Forums
- :
- Analytics
- :
- New to Qlik Analytics
- :
- Rolling Sum Of 12 Month
- Subscribe to RSS Feed
- Mark Topic as New
- Mark Topic as Read
- Float this Topic for Current User
- Bookmark
- Subscribe
- Mute
- Printer Friendly Page
- Mark as New
- Bookmark
- Subscribe
- Mute
- Subscribe to RSS Feed
- Permalink
- Report Inappropriate Content
Rolling Sum Of 12 Month
HI
I need to make line chart where on x axis would be months and day of today like if today is 17 april it would be , 17apr ,17mar ,17feb and on Y axis Would be Sum of amounts.
From every date There Should be sum of last 12 month, like if it is 17 april, on chart this point should Show sum of amount from 16/04/2017 to 17/04/20178 and so on for every date on line Chart.
- « Previous Replies
-
- 1
- 2
- Next Replies »
- Mark as New
- Bookmark
- Subscribe
- Mute
- Subscribe to RSS Feed
- Permalink
- Report Inappropriate Content
so try this:
=RangeSum(above(total sum({<[Year Month]={">=$(=Date(Addmonths(Date#([Year Month],'MMM-YYYY'),-12),'MMM-YYYY'))<=$(=Max([Year Month]))"}>}Measure_field),0,12))
- Mark as New
- Bookmark
- Subscribe
- Mute
- Subscribe to RSS Feed
- Permalink
- Report Inappropriate Content
it doesn't work 
- Mark as New
- Bookmark
- Subscribe
- Mute
- Subscribe to RSS Feed
- Permalink
- Report Inappropriate Content
My bad, this should work:
=RangeSum(above(total sum({<[Year Month]={">=$(=Date(AddMonths(Max([Year Month]),-12),'MMM-YYYY'))<=$(=Max([Year Month]))"}>}Measure_field),0,12))
- Mark as New
- Bookmark
- Subscribe
- Mute
- Subscribe to RSS Feed
- Permalink
- Report Inappropriate Content
it doesn't work I also tried this ,
RangeSum(above(total Sum( {$<Date={">=$(=MonthStart(AddMonths(Max(Date),-12)))<$(=MonthEnd(Max(Date)))"}>} FactSoldAmount),0,12)) --
it shows last 12 months but the sum is only correct for April
- Mark as New
- Bookmark
- Subscribe
- Mute
- Subscribe to RSS Feed
- Permalink
- Report Inappropriate Content
would you be able to attach sample data ? or sample app ?
- Mark as New
- Bookmark
- Subscribe
- Mute
- Subscribe to RSS Feed
- Permalink
- Report Inappropriate Content
Hi,
did you solve the problem? Unfortunately I have the same problem.
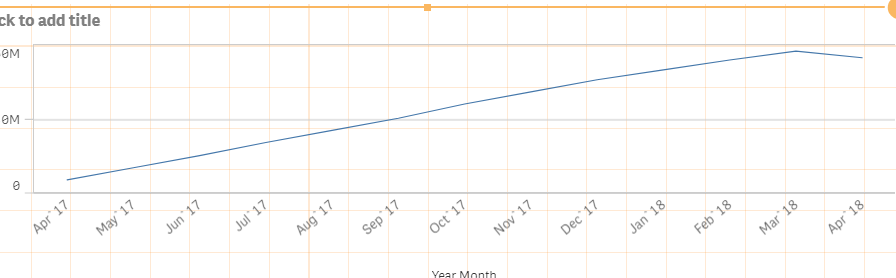
I want to show the sum over the last 12 months in a bar but the chart should only show the last 13 months (via set analysis in the expression). Example: Jan 2018 is selected, then I want to display bars from Jan 2017 - Jan 2018 (13 month) and every bar is the sum of one year (Jan 2018 = sum (Feb 2017- Jan 2018)). Unfortunately, the first months are not correct, because Qlik refers the month selection from the set analysis also to rangesum. so the bars rise slowly, although values before the 13 months are available. Total sum unfortunately does not solve this problem
Rangesum(Above(TOTAL SUM(
{$<Date.DateNum = {">=$(=Num(AddMonths(Max(Date.DateNum), -12,1)))<=$(=Num(AddMonths(Max(Date.DateNum), 0,1)))"}, Date.Month, Date.Year>}
Value),0,12))/1000000
- « Previous Replies
-
- 1
- 2
- Next Replies »