Unlock a world of possibilities! Login now and discover the exclusive benefits awaiting you.
- Qlik Community
- :
- Forums
- :
- Analytics
- :
- New to Qlik Analytics
- :
- Same measure different result on KPI vs Pivot Tabl...
- Subscribe to RSS Feed
- Mark Topic as New
- Mark Topic as Read
- Float this Topic for Current User
- Bookmark
- Subscribe
- Mute
- Printer Friendly Page
- Mark as New
- Bookmark
- Subscribe
- Mute
- Subscribe to RSS Feed
- Permalink
- Report Inappropriate Content
Same measure different result on KPI vs Pivot Table
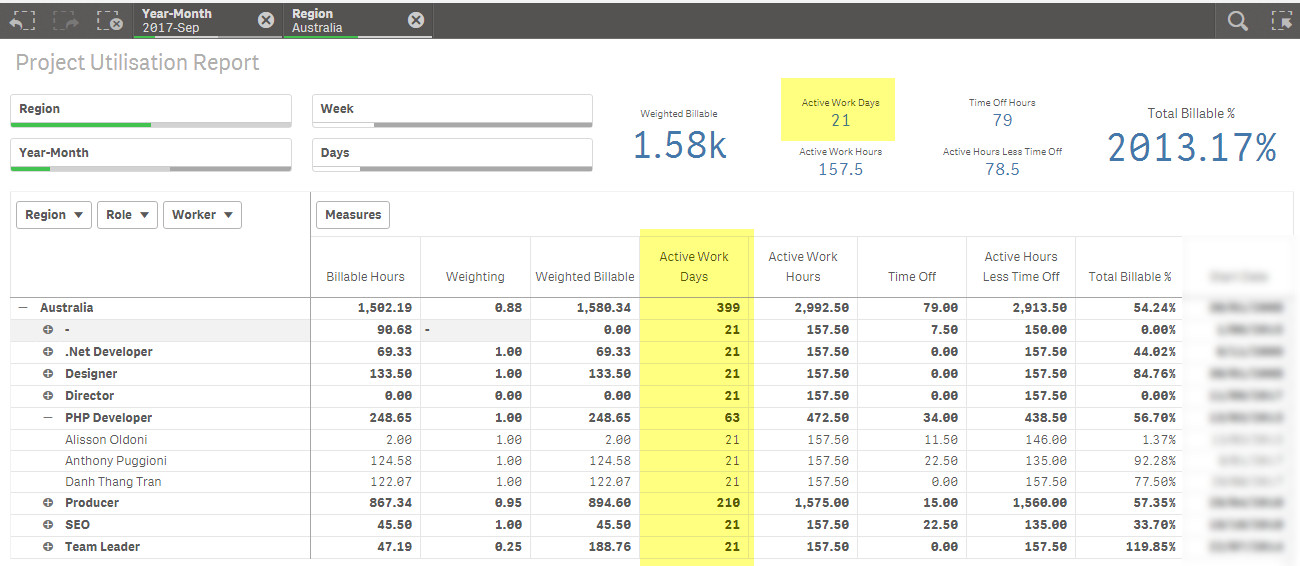
The same measure (Active Work Days) produces a different result when used on the KPI object compared to the Pivot Table object
The numbers in the Pivot table are correct at all levels of the hierarchy (Region, Role and Worker) but the number in the KPI object is showing the value at the lowest level only. I need it to reflect the value for the selected Region, Role or Worker and also for the Month/s or Week/s that are selected.

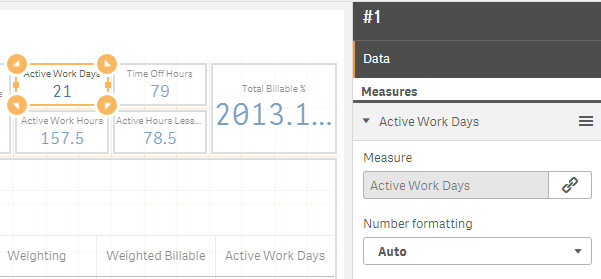
This is the definition of the KPI object

This is the definition of the Pivot Table object.

Here are the definitions of the measure and the variable it depends on
MEASURE: Active Work Days

VARIABLE: vActiveWorkDaysInPeriod
Number of workdays (excluding weekends) in the selected period, less any days where a worker started or ended with us in the selected period. Uses the WeekStart() and MonthStart() functions so that it counts the number of days in the week or month regardless of whether a worker has logged time for those days or not.

Accepted Solutions
- Mark as New
- Bookmark
- Subscribe
- Mute
- Subscribe to RSS Feed
- Permalink
- Report Inappropriate Content
I was going to delete this post becausae I managed to solve this problem thanks in part to stalwar1 who offered a solution to another question I posted.
Aggregate values instead recalculate up a hierarchy
But I thought I'd leave it here in case another "newbie" like myself had a similar problem.
I change the measure from...
sum($(vActiveWorkDaysInPeriod))
to...
sum(Aggr($(vActiveWorkDaysInPeriod), Region, Role, Worker))