Unlock a world of possibilities! Login now and discover the exclusive benefits awaiting you.
- Qlik Community
- :
- Forums
- :
- Analytics
- :
- New to Qlik Analytics
- :
- Scatter Plots final question
- Subscribe to RSS Feed
- Mark Topic as New
- Mark Topic as Read
- Float this Topic for Current User
- Bookmark
- Subscribe
- Mute
- Printer Friendly Page
- Mark as New
- Bookmark
- Subscribe
- Mute
- Subscribe to RSS Feed
- Permalink
- Report Inappropriate Content
Scatter Plots final question
Ladies and Gentlemen,
Please find enclosed my final questions related to Scatter Plots (bubble charts)
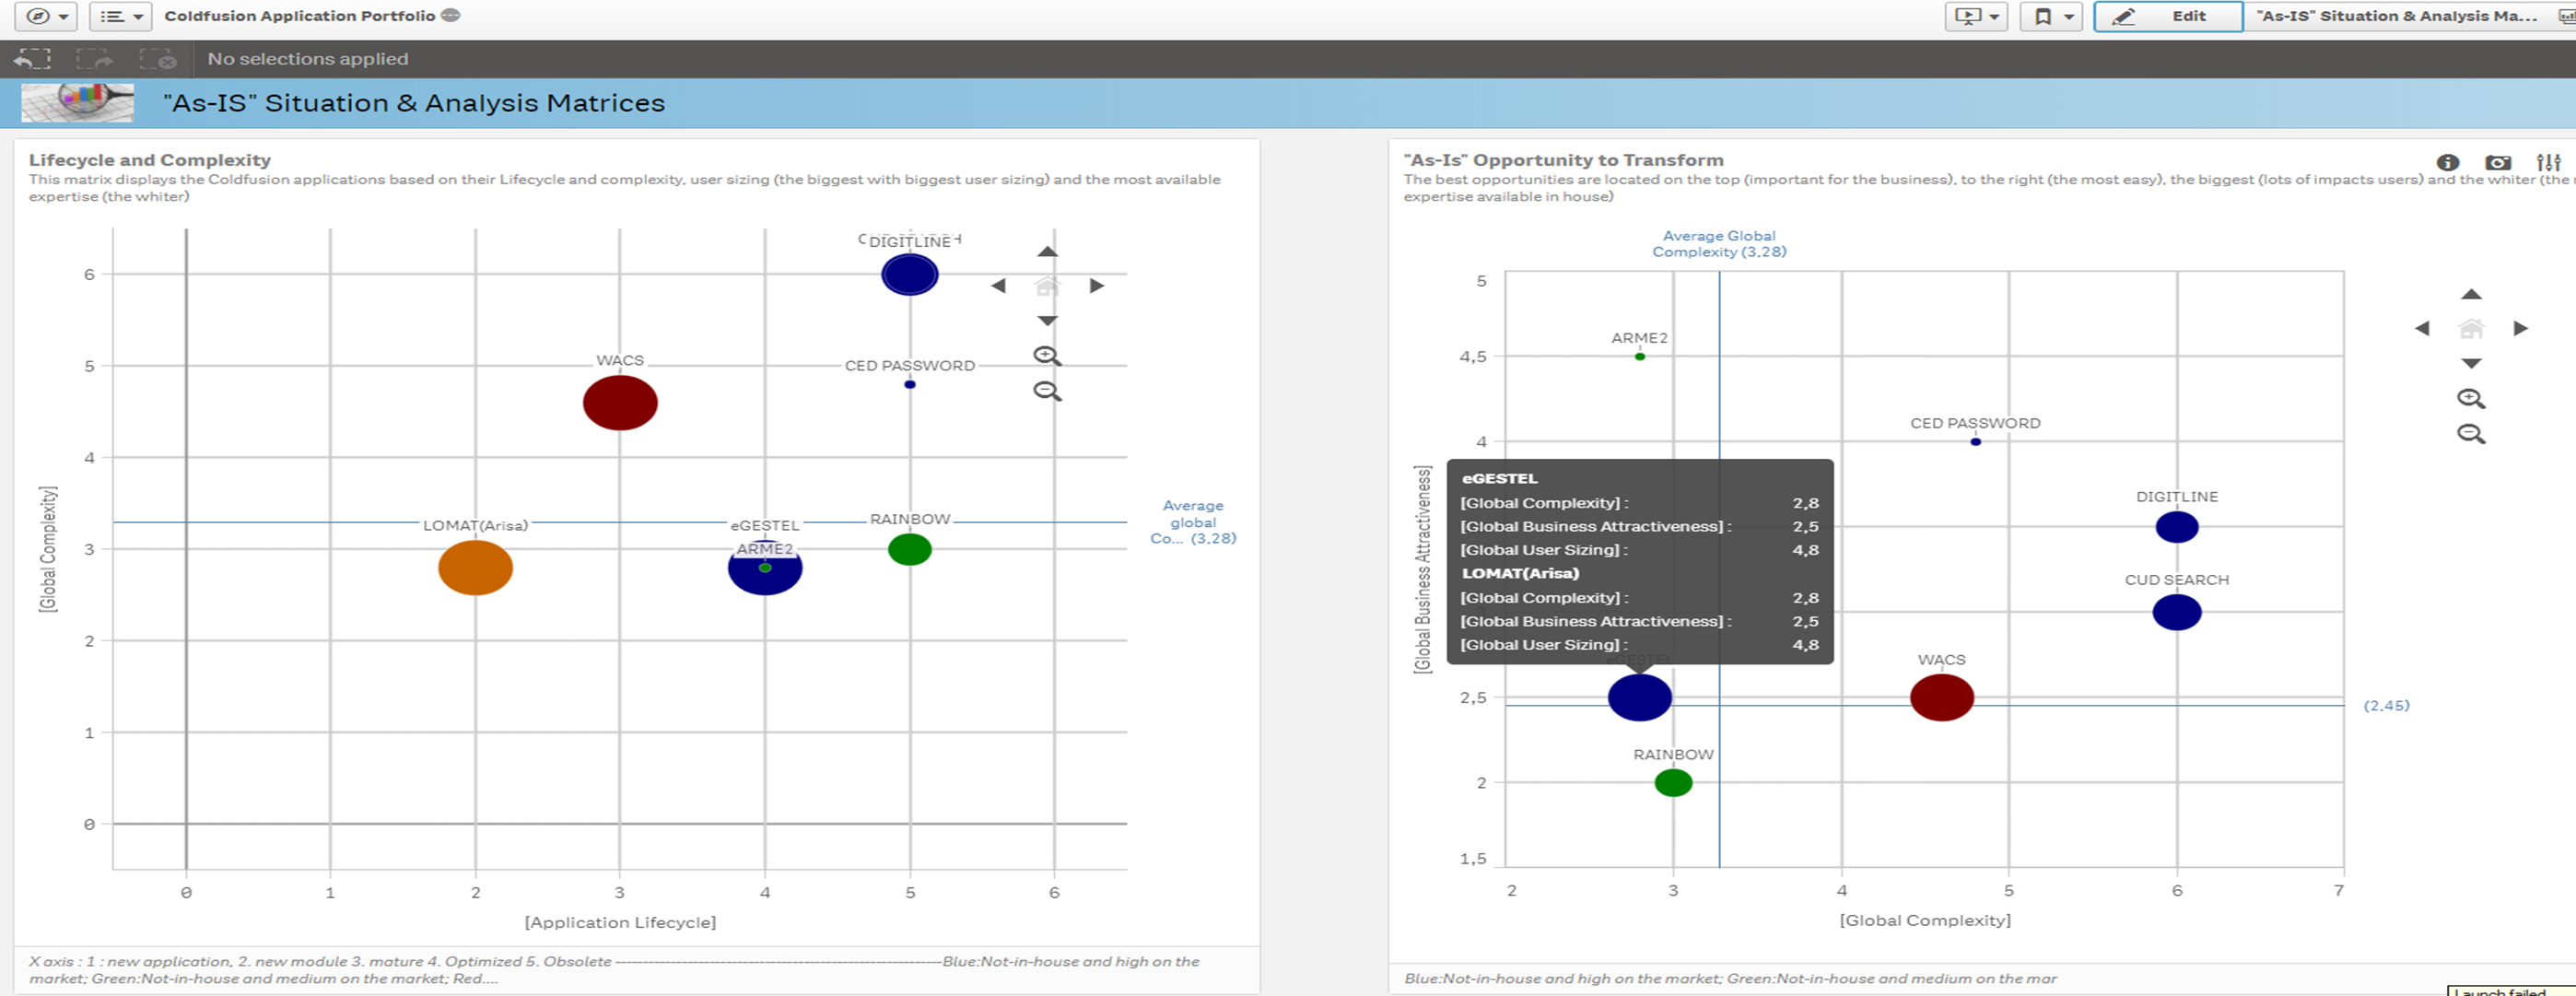
1° I have got a problem with the refreshing of the bubble chart on the right of the "As IS" situation & analysis matrices sheet : each time I refresh the page, the chart is displayed empty. I must select the color by dimension and then re-select by expression to have it displayed again.
There is an error in the color argument value (below)
-Question 1 : any idea to fix this ?
2° In the second attachment (scatterplotsfinalquestions) :
-Question 2 : how could I force to display the bubble when 2 are at the same location, or at least force to display the legend ?
-Question 3 : how to have the font of the character in black for more contrast that the light grey that is difficult to read ?
-Question 4 : how to make the footnote bigger (it is to small to read)?
-Question 5 : do you have further info about the "pick" function? It is working with absolute value but not with non-integer values….
when the values that must be display are 2.8 or 4.8 (always from 1 to 6), it is not working...
Many thx alrready to the Qlik Community
Cheers,
E