Unlock a world of possibilities! Login now and discover the exclusive benefits awaiting you.
- Qlik Community
- :
- Forums
- :
- Analytics
- :
- New to Qlik Analytics
- :
- Set Analysis/If statement date range query
- Subscribe to RSS Feed
- Mark Topic as New
- Mark Topic as Read
- Float this Topic for Current User
- Bookmark
- Subscribe
- Mute
- Printer Friendly Page
- Mark as New
- Bookmark
- Subscribe
- Mute
- Subscribe to RSS Feed
- Permalink
- Report Inappropriate Content
Set Analysis/If statement date range query
Hello,
I have the below data as an example and I am struggling to get correct formula for sales before and after "Date Change Made" per project and also count of number of weeks before and after "Date Change Made", regardless of whether there is a transaction in a week or not.
[ProjectData]:
Project Name, SKU , Date Change Made
A , 123 , 28/02/2018
A , 456 , 28/02/2018
A , 789 , 28/02/2018
B , 123 , 01/02/2018
B , 101 , 01/02/2018
B , 102 , 01/02/2018
[SalesData]:
Invoice No, Invoice Date , SKU , Sales Total
001, 01/01/2018 ,123 ,100
002, 01/02/2018 ,456 ,100
003, 01/03/2018 ,789 ,100
004, 01/01/2018 ,123 ,100
005, 01/02/2018 ,101 ,100
006, 01/03/2018 ,102 ,100
007, 01/01/2018 ,789 ,100
[Calendar]:
Invoice Date, YearWeek
01/01/2018 , 2018-01
01/02/2018 , 2018-05
01/03/2018 , 2018-09
I want to sum sales per project which is fine.
I then want to sum sales per project where the invoice is within the 6 months prior to "Date Change Made" per project.
The same for sum sales where invoice is after "Date Change Made" per project.
For sales before and after i have something like this:
Sum(if([Sales Invoice Date]<[Date change in front of customer] and [Is Sales Account]='Yes',[Sales Total (GBP)]))
Sum(if([Sales Invoice Date]>=[Date change in front of customer] and [Is Sales Account]='Yes',[Sales Total (GBP)]))
Can this be done in set analysis instead when there are different "Date Change Made" values?
For the count of weeks I have this:
count(distinct if([Sales Invoice Date]>=Date(addmonths([Date change in front of customer],-6)) and [Sales Invoice Date]<[Date change in front of customer] ,[Sales Invoice Date.Calendar.YearWeek]))
But I need to count all YearWeek in the past 6 months and not just those that have a transaction in them.
Any help is appreciated.
Adam
Accepted Solutions
- Mark as New
- Bookmark
- Subscribe
- Mute
- Subscribe to RSS Feed
- Permalink
- Report Inappropriate Content
Set analysis is evaluated once per chart.... in your case, the [Date Change Made] is different per project which will essentially make it unusable in set analysis. If statement is the way to solve this problem....
- Mark as New
- Bookmark
- Subscribe
- Mute
- Subscribe to RSS Feed
- Permalink
- Report Inappropriate Content
Would you be able to share the expected output (numeric output) based on the sample you have provided?
- Mark as New
- Bookmark
- Subscribe
- Mute
- Subscribe to RSS Feed
- Permalink
- Report Inappropriate Content
Use something like this when Project Name is your dimension -
Sum({<[Invoice Date]={">$(=Max(Aggr(AddMonths([Date Change Made],-6),[Project Name])))"}>}[Sales Total])
One obervation - You have common SKU '123' for both project A and B, so I think one invoice row for SKU 123 will be double counted for Project A and B.
- Mark as New
- Bookmark
- Subscribe
- Mute
- Subscribe to RSS Feed
- Permalink
- Report Inappropriate Content
Hello,
Output for the example data there would be:
Project / Date of Change / Sales Before / # weeks (6 months prior to date change) / Sales After / # Weeks (up to today)
Project A / 28/02/2018 / 300 / 27 / 100 / 4
Project B / 01/02/2018 / 200 / 27 / 200 / 8
The calendar does contain missing dates and therefore missing weeks which need counting.
There are 7 invoices total to £700 but £800 will appear in the results as sku 123 can appear in both project results.
Thanks
- Mark as New
- Bookmark
- Subscribe
- Mute
- Subscribe to RSS Feed
- Permalink
- Report Inappropriate Content
Hi,
That doesn't quite give the correct answer.
Take this real data as an example.
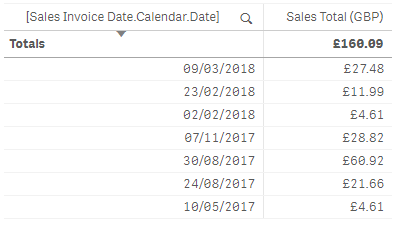
For project name = 'no_description_SKUs_20180227' total sales is £160.09. The "Date Change Made" for this project is 28/02/2018.
So counting sales in 12 months prior to today should add to £160.09 using the invoice data on the right.
However it is missing the transaction on 10/05/2017 as it is not calculating the "Date Change Made" correctly. Another project has a "Date Change Made" of 29/05/2018 so it must be using this and not 28/02/2018
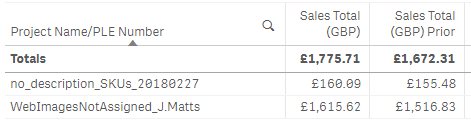
Seems to be taking the max date of all projects and not per project.
Thanks
- Mark as New
- Bookmark
- Subscribe
- Mute
- Subscribe to RSS Feed
- Permalink
- Report Inappropriate Content
So, far I got this.... why is A not 400 for Sales Before?
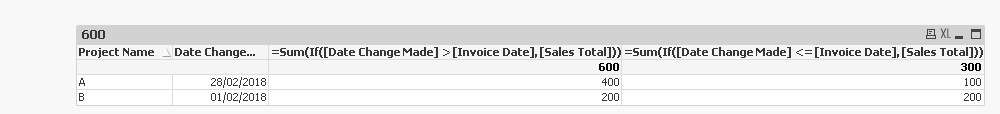
Shouldn't we include these 4 rows?
Invoice No, Invoice Date , SKU , Sales Total
001, 01/01/2018 ,123 ,100
002, 01/02/2018 ,456 ,100
003, 01/03/2018 ,789 ,100
004, 01/01/2018 ,123 ,100
005, 01/02/2018 ,101 ,100
006, 01/03/2018 ,102 ,100
007, 01/01/2018 ,789 ,100
- Mark as New
- Bookmark
- Subscribe
- Mute
- Subscribe to RSS Feed
- Permalink
- Report Inappropriate Content
Hi ,
Yes sorry you are correct, project A before date of change should be 400.
I think I have it working with if statements similar to what you have. I was just tried to do it with set analysis but i am struggling there as even using max and aggr it is evaluating to the wrong dates.
Thanks
- Mark as New
- Bookmark
- Subscribe
- Mute
- Subscribe to RSS Feed
- Permalink
- Report Inappropriate Content
Set analysis is evaluated once per chart.... in your case, the [Date Change Made] is different per project which will essentially make it unusable in set analysis. If statement is the way to solve this problem....
- Mark as New
- Bookmark
- Subscribe
- Mute
- Subscribe to RSS Feed
- Permalink
- Report Inappropriate Content
OK I will just carry on with the IF statements for now then as they seem to be working ok. It is a relatively small data set so it shouldn't case any performance issues.
Many Thanks