Unlock a world of possibilities! Login now and discover the exclusive benefits awaiting you.
- Qlik Community
- :
- Forums
- :
- Analytics
- :
- New to Qlik Analytics
- :
- Set analysis
- Subscribe to RSS Feed
- Mark Topic as New
- Mark Topic as Read
- Float this Topic for Current User
- Bookmark
- Subscribe
- Mute
- Printer Friendly Page
- Mark as New
- Bookmark
- Subscribe
- Mute
- Subscribe to RSS Feed
- Permalink
- Report Inappropriate Content
Set analysis
Hi Experts,
Can any one please help me on below requirement.
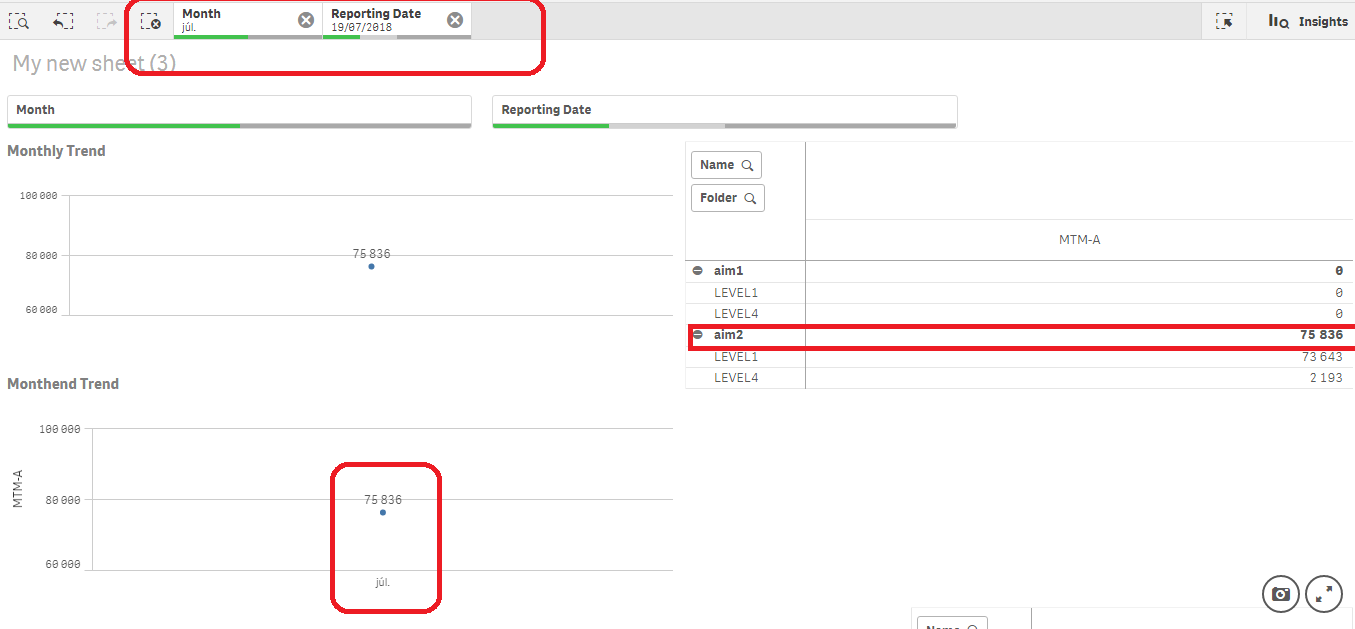
In the below attached app ,In Month end Trend chart need to get 75,836 value instead of Zero. I have included the formula in the application in this chart.

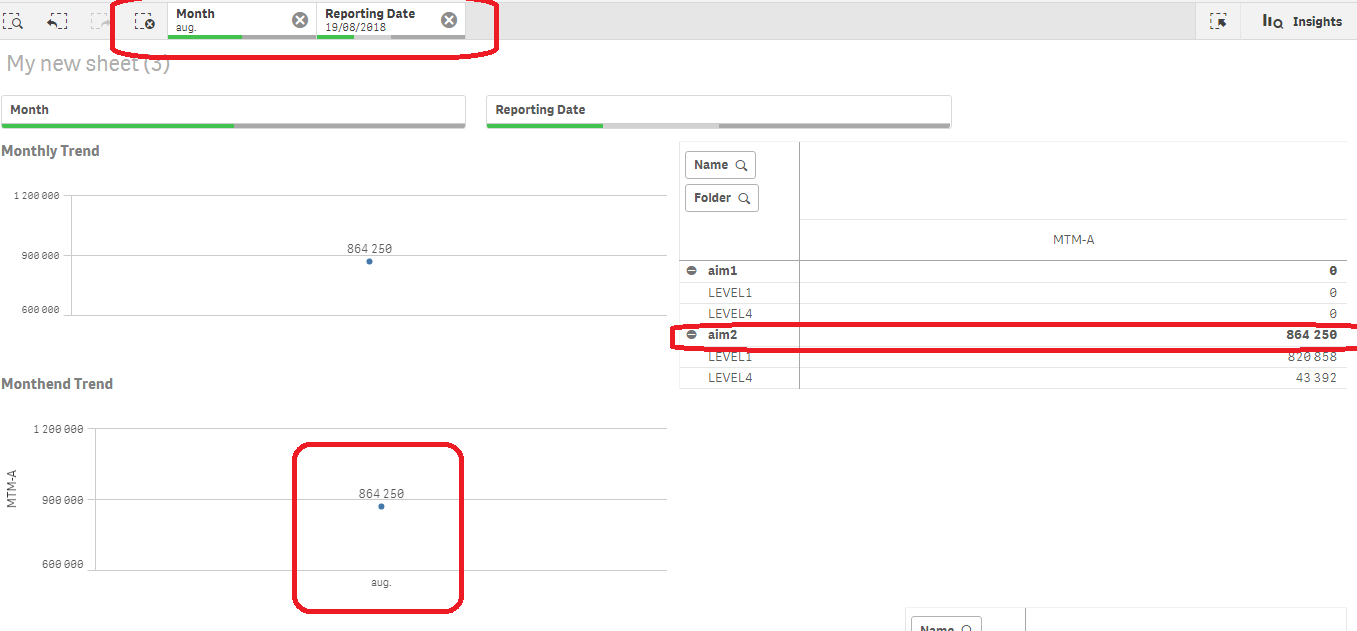
The values are coming like In Jul Month Max Reporting date is 19/07/2018 that date value 75,836 need to show on trend same for aug.
For aug getting correct value as max(date) value.


Please help me to show all the months Max(Date) values by default.
Thanks in advance.
Accepted Solutions
- Mark as New
- Bookmark
- Subscribe
- Mute
- Subscribe to RSS Feed
- Permalink
- Report Inappropriate Content
Hi,
I have found the solution.
Below Expression is working fine.
=Sum(Aggr((Sum({<Type={'A'},Date=p(New_Date)>}Amount)*
Avg({<Date=p(New_Date)>}A1%)),Date,Dept,Branch))
- Mark as New
- Bookmark
- Subscribe
- Mute
- Subscribe to RSS Feed
- Permalink
- Report Inappropriate Content
Hi.Try this expression
=Sum(Aggr((Sum({<Type={'A'},Date={$(=Chr(39)&Concat(DISTINCT Date(MonthEnd(Date),'DD/MM/YYYY'), Chr(39)&Chr(44)& Chr(39))& Chr(39))}>}Amount)* Avg({<Date={$(=Chr(39)&Concat(DISTINCT Date(MonthEnd(Date),'DD/MM/YYYY'), Chr(39)&Chr(44)& Chr(39))& Chr(39))}>}A1%)),Date,Dept,Branch))
or the same but a little bit shorter
=Sum(Aggr((Sum({<Type={'A'},Date={$(='"'&Concat(DISTINCT Date(MonthEnd(Date),'DD/MM/YYYY'), '","')&'"')}>}Amount)* Avg({<Date={$(='"'&Concat(DISTINCT Date(MonthEnd(Date),'DD/MM/YYYY'), '","')&'"')}>}A1%)),Date,Dept,Branch))
- Mark as New
- Bookmark
- Subscribe
- Mute
- Subscribe to RSS Feed
- Permalink
- Report Inappropriate Content
I'm sorry, I have no QS in front of me.
- Mark as New
- Bookmark
- Subscribe
- Mute
- Subscribe to RSS Feed
- Permalink
- Report Inappropriate Content
Hi Mahita,
I can suggest you to create a flag in the load script, that indicate the last day of month, the max([Report Date]) returns the max date of the whole application, not by dimension.
G.
- Mark as New
- Bookmark
- Subscribe
- Mute
- Subscribe to RSS Feed
- Permalink
- Report Inappropriate Content
Hi,
I have found the solution.
Below Expression is working fine.
=Sum(Aggr((Sum({<Type={'A'},Date=p(New_Date)>}Amount)*
Avg({<Date=p(New_Date)>}A1%)),Date,Dept,Branch))