Unlock a world of possibilities! Login now and discover the exclusive benefits awaiting you.
- Qlik Community
- :
- Forums
- :
- Analytics
- :
- New to Qlik Analytics
- :
- Show alternative values
- Subscribe to RSS Feed
- Mark Topic as New
- Mark Topic as Read
- Float this Topic for Current User
- Bookmark
- Subscribe
- Mute
- Printer Friendly Page
- Mark as New
- Bookmark
- Subscribe
- Mute
- Subscribe to RSS Feed
- Permalink
- Report Inappropriate Content
Show alternative values
Hi everybody,
I have a list of locations in a chart and I would like to show the unselected values in a table near it.
How could I do this?
Thanks for your help and for your attention 
Best regards
Nicolò Cogno
- Tags:
- unselected
Accepted Solutions
- Mark as New
- Bookmark
- Subscribe
- Mute
- Subscribe to RSS Feed
- Permalink
- Report Inappropriate Content
- Mark as New
- Bookmark
- Subscribe
- Mute
- Subscribe to RSS Feed
- Permalink
- Report Inappropriate Content
Hi Nicolò,
Try the attached sample:
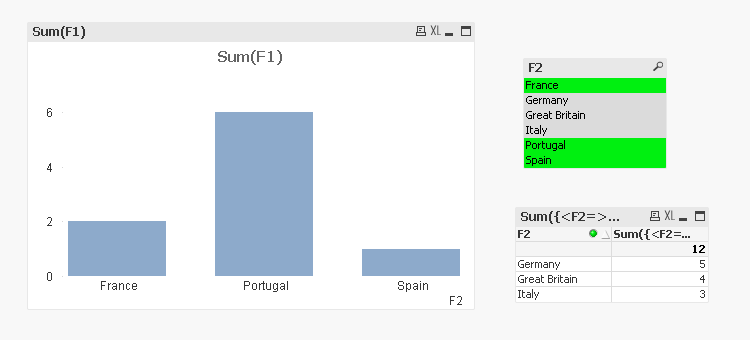
I hope it is useful.
Regards,
H
- Mark as New
- Bookmark
- Subscribe
- Mute
- Subscribe to RSS Feed
- Permalink
- Report Inappropriate Content
Hi Hèctor and thanks for your help, but I posted into the "Qlik Sense" section!! Could you please show me the Sense way of doing that?
- Mark as New
- Bookmark
- Subscribe
- Mute
- Subscribe to RSS Feed
- Permalink
- Report Inappropriate Content
Sorry,
I attach a Sense sample:
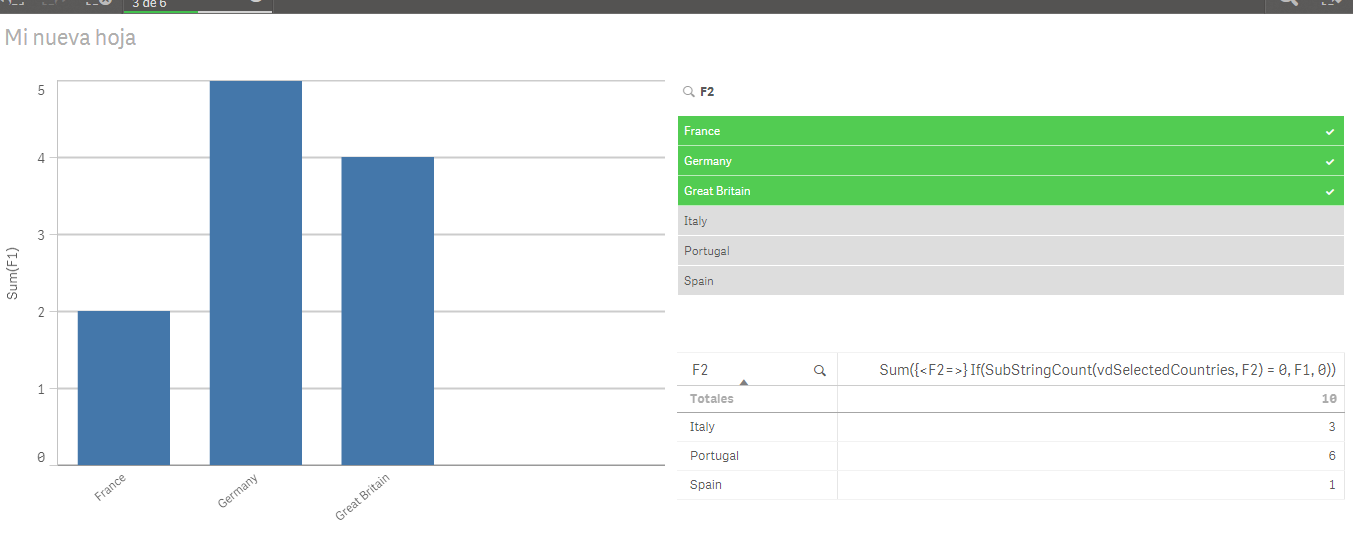
Regards,
H
- Mark as New
- Bookmark
- Subscribe
- Mute
- Subscribe to RSS Feed
- Permalink
- Report Inappropriate Content
Thanks a lot for your help
- Mark as New
- Bookmark
- Subscribe
- Mute
- Subscribe to RSS Feed
- Permalink
- Report Inappropriate Content
Another solution is a list box with expression (in place of field):
=aggr(only({1-$} Location), Location)
- Mark as New
- Bookmark
- Subscribe
- Mute
- Subscribe to RSS Feed
- Permalink
- Report Inappropriate Content
Hi Michael,
I tried everyrhing but I can't understand why your expression doesn't work  I can olny see a ' - '.
Can you please help me solving this?
Thanks a lot!
- Mark as New
- Bookmark
- Subscribe
- Mute
- Subscribe to RSS Feed
- Permalink
- Report Inappropriate Content
I did test it before sending to you, and just tested again. It works. Make sure that the field name is correct.
Besides, make sure you make some selections in the field itself to get that least of the excluded values in the calculated list box.
- Mark as New
- Bookmark
- Subscribe
- Mute
- Subscribe to RSS Feed
- Permalink
- Report Inappropriate Content
Thanks for your time Michael, I will try again! Do I just need to create a dimension with that expression or do I also need to put something into the load script?
My field only contains strings and not numbers!
Could you please attach an example file? Thanks a lot!!!
EDIT: I apologize, but I was using the expression in a table beacuse I thought it worked the same way as the listbox.
So here's my last question: can I use the expression in a chart?
Thanks again for your time