Unlock a world of possibilities! Login now and discover the exclusive benefits awaiting you.
- Qlik Community
- :
- Forums
- :
- Analytics
- :
- New to Qlik Analytics
- :
- Show value labels for stacked bars
- Subscribe to RSS Feed
- Mark Topic as New
- Mark Topic as Read
- Float this Topic for Current User
- Bookmark
- Subscribe
- Mute
- Printer Friendly Page
- Mark as New
- Bookmark
- Subscribe
- Mute
- Subscribe to RSS Feed
- Permalink
- Report Inappropriate Content
Show value labels for stacked bars
I have an app with a few stacked bars. I was wondering how you get the value labels to display for each dimension making up the total?
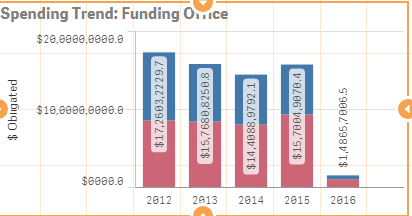
As you can see, the value label is for the whole bar, I would like to display a total for the two components which make up the total
Accepted Solutions
- Mark as New
- Bookmark
- Subscribe
- Mute
- Subscribe to RSS Feed
- Permalink
- Report Inappropriate Content
As you can see there is no space to nicely display the labels on the chart so qliks responsive design doesn't allow it to be displayed. On hover over you can see the value.
- Mark as New
- Bookmark
- Subscribe
- Mute
- Subscribe to RSS Feed
- Permalink
- Report Inappropriate Content
As you can see there is no space to nicely display the labels on the chart so qliks responsive design doesn't allow it to be displayed. On hover over you can see the value.
- Mark as New
- Bookmark
- Subscribe
- Mute
- Subscribe to RSS Feed
- Permalink
- Report Inappropriate Content
Thank you! Hover will have to do!
- Mark as New
- Bookmark
- Subscribe
- Mute
- Subscribe to RSS Feed
- Permalink
- Report Inappropriate Content
I think that's the mentality you need to have using sense especially if you have used View before. View is highly customisable but doesn't display well in varied viewport environments due to its precise and static layout nature. Qlik have thought about this and have designed their chart objects to work on mobiles, tablets, PCs equaly well which means uses and developers need to get used to different ways of accessing their data.