Unlock a world of possibilities! Login now and discover the exclusive benefits awaiting you.
- Qlik Community
- :
- Forums
- :
- Analytics
- :
- New to Qlik Analytics
- :
- Show zeros values in Pie Chart QlikSense
- Subscribe to RSS Feed
- Mark Topic as New
- Mark Topic as Read
- Float this Topic for Current User
- Bookmark
- Subscribe
- Mute
- Printer Friendly Page
- Mark as New
- Bookmark
- Subscribe
- Mute
- Subscribe to RSS Feed
- Permalink
- Report Inappropriate Content
Show zeros values in Pie Chart QlikSense
Hello All,
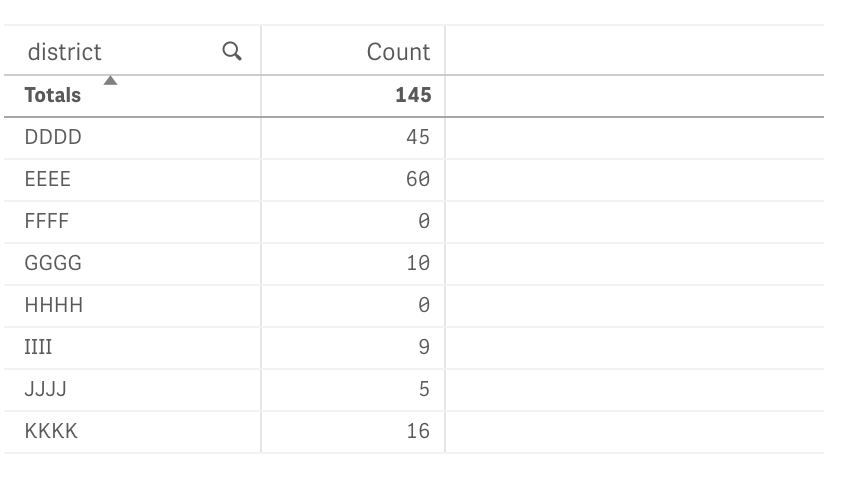
I have a pie chart wherein I show top cities with their minimum count. Some cities have 0 count but they don't get featured in the pie chart. I need to show these cities as well who have 0 count in the pie chart. I have attached a image for reference
Regards
Accepted Solutions
- Mark as New
- Bookmark
- Subscribe
- Mute
- Subscribe to RSS Feed
- Permalink
- Report Inappropriate Content
Prateek,
You can use the RangeMax function to "fake" a Zero value and trick the pie chart (with rounding count to the nearest Integer)...
See the attached QFV for details, but you need to add the following to the loading script:
Data:
NoConcatenate Load
district,
RangeMax(0.00000001, count) as count
resident Data_Raw;
Assuming the Data_Raw table contains your original raw data.
And use the num(Sum(count), '##0') as Measure in your Pie-Chart.
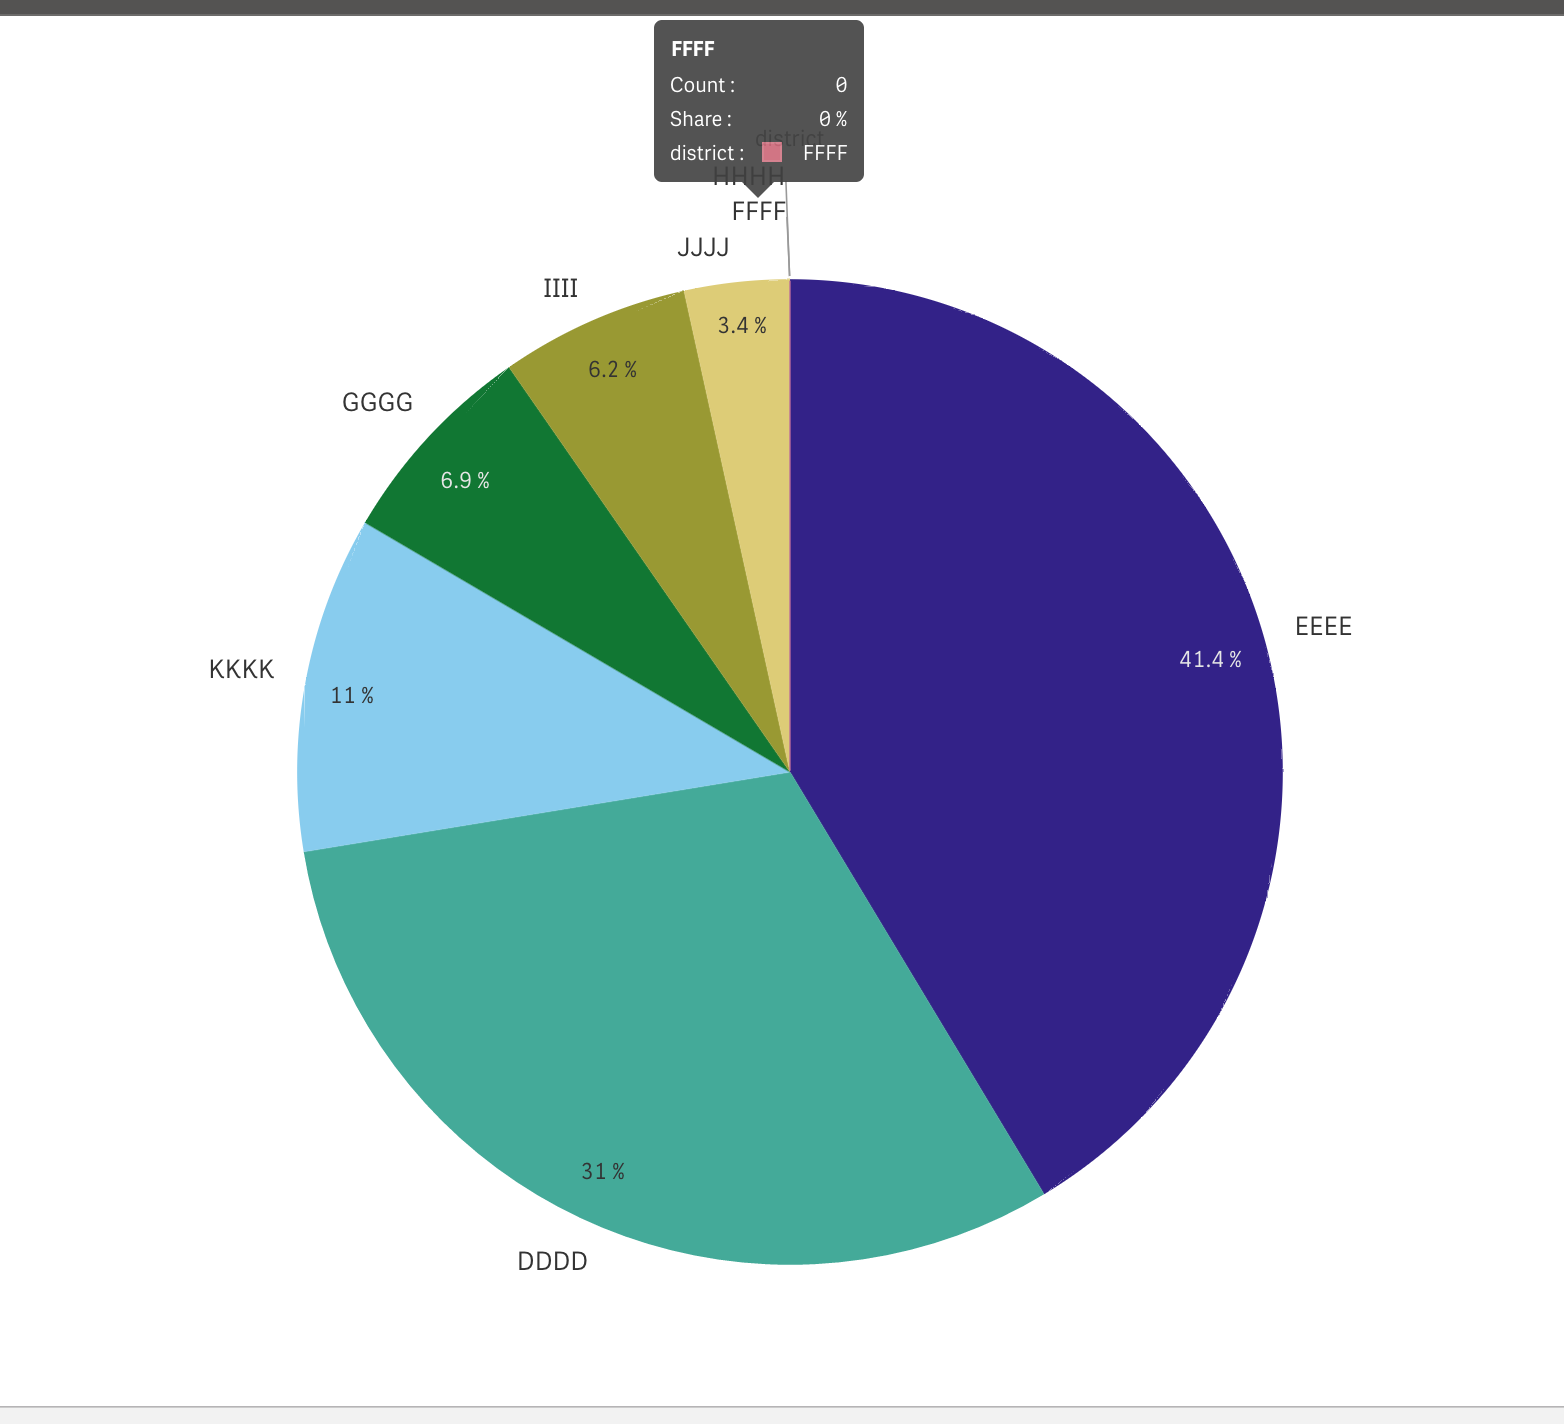
It produces the results you need (district FFFF contains 0 counts, but still represented on the chart):


Regards,
Vlad
- Mark as New
- Bookmark
- Subscribe
- Mute
- Subscribe to RSS Feed
- Permalink
- Report Inappropriate Content
Prateek,
You can use the RangeMax function to "fake" a Zero value and trick the pie chart (with rounding count to the nearest Integer)...
See the attached QFV for details, but you need to add the following to the loading script:
Data:
NoConcatenate Load
district,
RangeMax(0.00000001, count) as count
resident Data_Raw;
Assuming the Data_Raw table contains your original raw data.
And use the num(Sum(count), '##0') as Measure in your Pie-Chart.
It produces the results you need (district FFFF contains 0 counts, but still represented on the chart):


Regards,
Vlad
- Mark as New
- Bookmark
- Subscribe
- Mute
- Subscribe to RSS Feed
- Permalink
- Report Inappropriate Content
This is great! Thank you Vladimir Kamarov ![]()
- Mark as New
- Bookmark
- Subscribe
- Mute
- Subscribe to RSS Feed
- Permalink
- Report Inappropriate Content
You are welcome!
VK