Unlock a world of possibilities! Login now and discover the exclusive benefits awaiting you.
- Qlik Community
- :
- Forums
- :
- Analytics
- :
- New to Qlik Analytics
- :
- Re: Sum of Market share gives 1000% instead of 100...
- Subscribe to RSS Feed
- Mark Topic as New
- Mark Topic as Read
- Float this Topic for Current User
- Bookmark
- Subscribe
- Mute
- Printer Friendly Page
- Mark as New
- Bookmark
- Subscribe
- Mute
- Subscribe to RSS Feed
- Permalink
- Report Inappropriate Content
Sum of Market share gives 1000% instead of 100%
Hi,
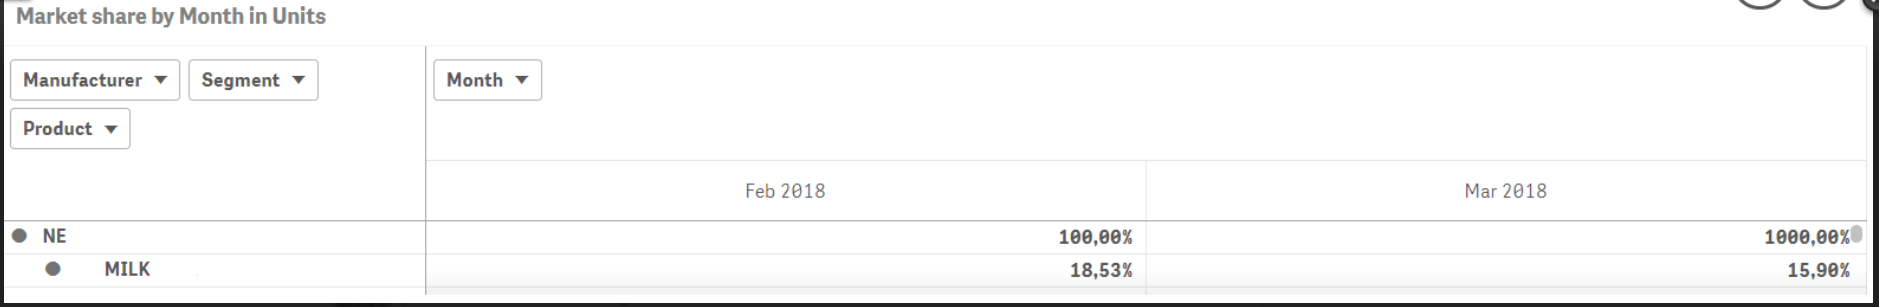
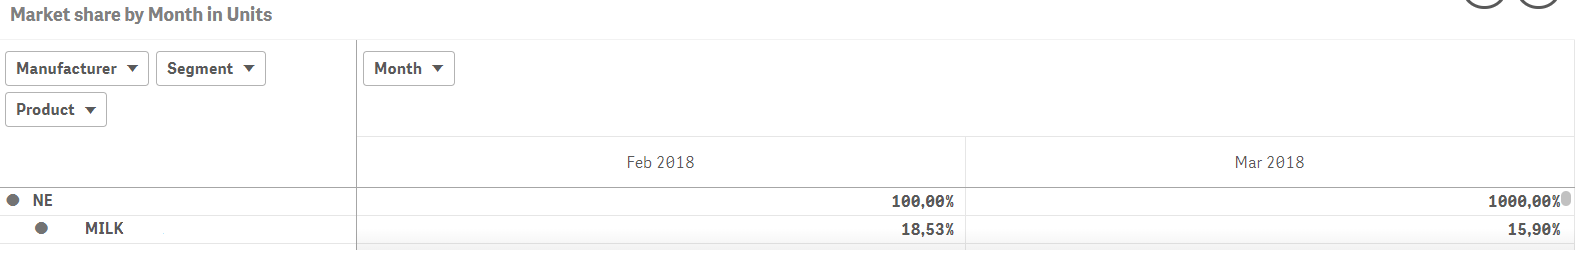
Percent is incorrectly calculated in a pivot table in Qlik Sense. Feb 2018 is fine because it shows 100% in total but in March 2018 the total shows 1000%. When I change the format to number without % than March 2018 value total is 10 instead of 1as expected.
Would you have already experienced this behaviour and would get a solution? Thx.
- Mark as New
- Bookmark
- Subscribe
- Mute
- Subscribe to RSS Feed
- Permalink
- Report Inappropriate Content
What expression are you using?
- Mark as New
- Bookmark
- Subscribe
- Mute
- Subscribe to RSS Feed
- Permalink
- Report Inappropriate Content
Hi Sunny,
here the expression I use:
sum( {$<$(vPeriod)>}$(vMeasure))/ sum(total {$<$(vPeriod)>}$(vMeasure))
&
sum( {$<$(vReferencePeriod)>}$(vMeasure)) / sum(total {$<$(vReferencePeriod)>}$(vMeasure))
Where vPeriod = March 2018, vReferencePeriod = February 2018 and vMeasure = Units
Thanks,
- Mark as New
- Bookmark
- Subscribe
- Mute
- Subscribe to RSS Feed
- Permalink
- Report Inappropriate Content
You have two expressions in the chart or just one?
- Mark as New
- Bookmark
- Subscribe
- Mute
- Subscribe to RSS Feed
- Permalink
- Report Inappropriate Content
Hi Sunny,
Yes two expressions are used. 1 for the chosen current period and the other for the referenced period. The user gets the ability to select in a drop down list the relative time period. In this example the chosen period is Month vs. Month-1.
Regards,
- Mark as New
- Bookmark
- Subscribe
- Mute
- Subscribe to RSS Feed
- Permalink
- Report Inappropriate Content
I mean which of the two expressions are giving you problem here?