Unlock a world of possibilities! Login now and discover the exclusive benefits awaiting you.
- Qlik Community
- :
- Forums
- :
- Analytics
- :
- New to Qlik Analytics
- :
- Switch measurements in a line chart
- Subscribe to RSS Feed
- Mark Topic as New
- Mark Topic as Read
- Float this Topic for Current User
- Bookmark
- Subscribe
- Mute
- Printer Friendly Page
- Mark as New
- Bookmark
- Subscribe
- Mute
- Subscribe to RSS Feed
- Permalink
- Report Inappropriate Content
Switch measurements in a line chart
Hello,
I have a problem and not get ahead.
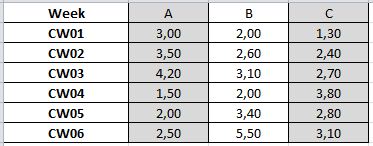
I have a excel table and make a line chart with 3 graphes A, B and C.
Showing all 3 graphes displayed simultaneously in the line chart.
How can I switch to a filter between A, B and C.
Thanks in advance!
Kai
Accepted Solutions
- Mark as New
- Bookmark
- Subscribe
- Mute
- Subscribe to RSS Feed
- Permalink
- Report Inappropriate Content
Hi Kai,
The issue is the structure of your data this data is in a 'cross table' format and you need to 'uncross' it to make it easier to use. There is a function you can add in the data load editor to do this called "Cross Table". I assume your data was made up of Products and Prices but you can choose any labels that makes sense. Your script would look something like this:
CrossTable(Product, Price, 1)
LOAD
"Week",
A,
"B",
C
FROM [lib://Desktop/Example Data.xlsx]
(ooxml, embedded labels, table is Sheet1);
I've also included an example QVF for your reference.
-Josh
Qlik
- Mark as New
- Bookmark
- Subscribe
- Mute
- Subscribe to RSS Feed
- Permalink
- Report Inappropriate Content
I use Qlik Sense Desktop.
- Mark as New
- Bookmark
- Subscribe
- Mute
- Subscribe to RSS Feed
- Permalink
- Report Inappropriate Content
Hi Kai,
The issue is the structure of your data this data is in a 'cross table' format and you need to 'uncross' it to make it easier to use. There is a function you can add in the data load editor to do this called "Cross Table". I assume your data was made up of Products and Prices but you can choose any labels that makes sense. Your script would look something like this:
CrossTable(Product, Price, 1)
LOAD
"Week",
A,
"B",
C
FROM [lib://Desktop/Example Data.xlsx]
(ooxml, embedded labels, table is Sheet1);
I've also included an example QVF for your reference.
-Josh
Qlik
- Mark as New
- Bookmark
- Subscribe
- Mute
- Subscribe to RSS Feed
- Permalink
- Report Inappropriate Content
Thanks Josh!