Unlock a world of possibilities! Login now and discover the exclusive benefits awaiting you.
- Qlik Community
- :
- Forums
- :
- Analytics
- :
- New to Qlik Analytics
- :
- Tab in the Y axis to specify another measure
- Subscribe to RSS Feed
- Mark Topic as New
- Mark Topic as Read
- Float this Topic for Current User
- Bookmark
- Subscribe
- Mute
- Printer Friendly Page
- Mark as New
- Bookmark
- Subscribe
- Mute
- Subscribe to RSS Feed
- Permalink
- Report Inappropriate Content
Tab in the Y axis to specify another measure
I have a Combo chart with dimension "Date" and 3 different metrics: Sum(Sales), Sum(Profit), and Sum (Quantity). Profit and Quantity are "alternative measures". The look of the report is the following:
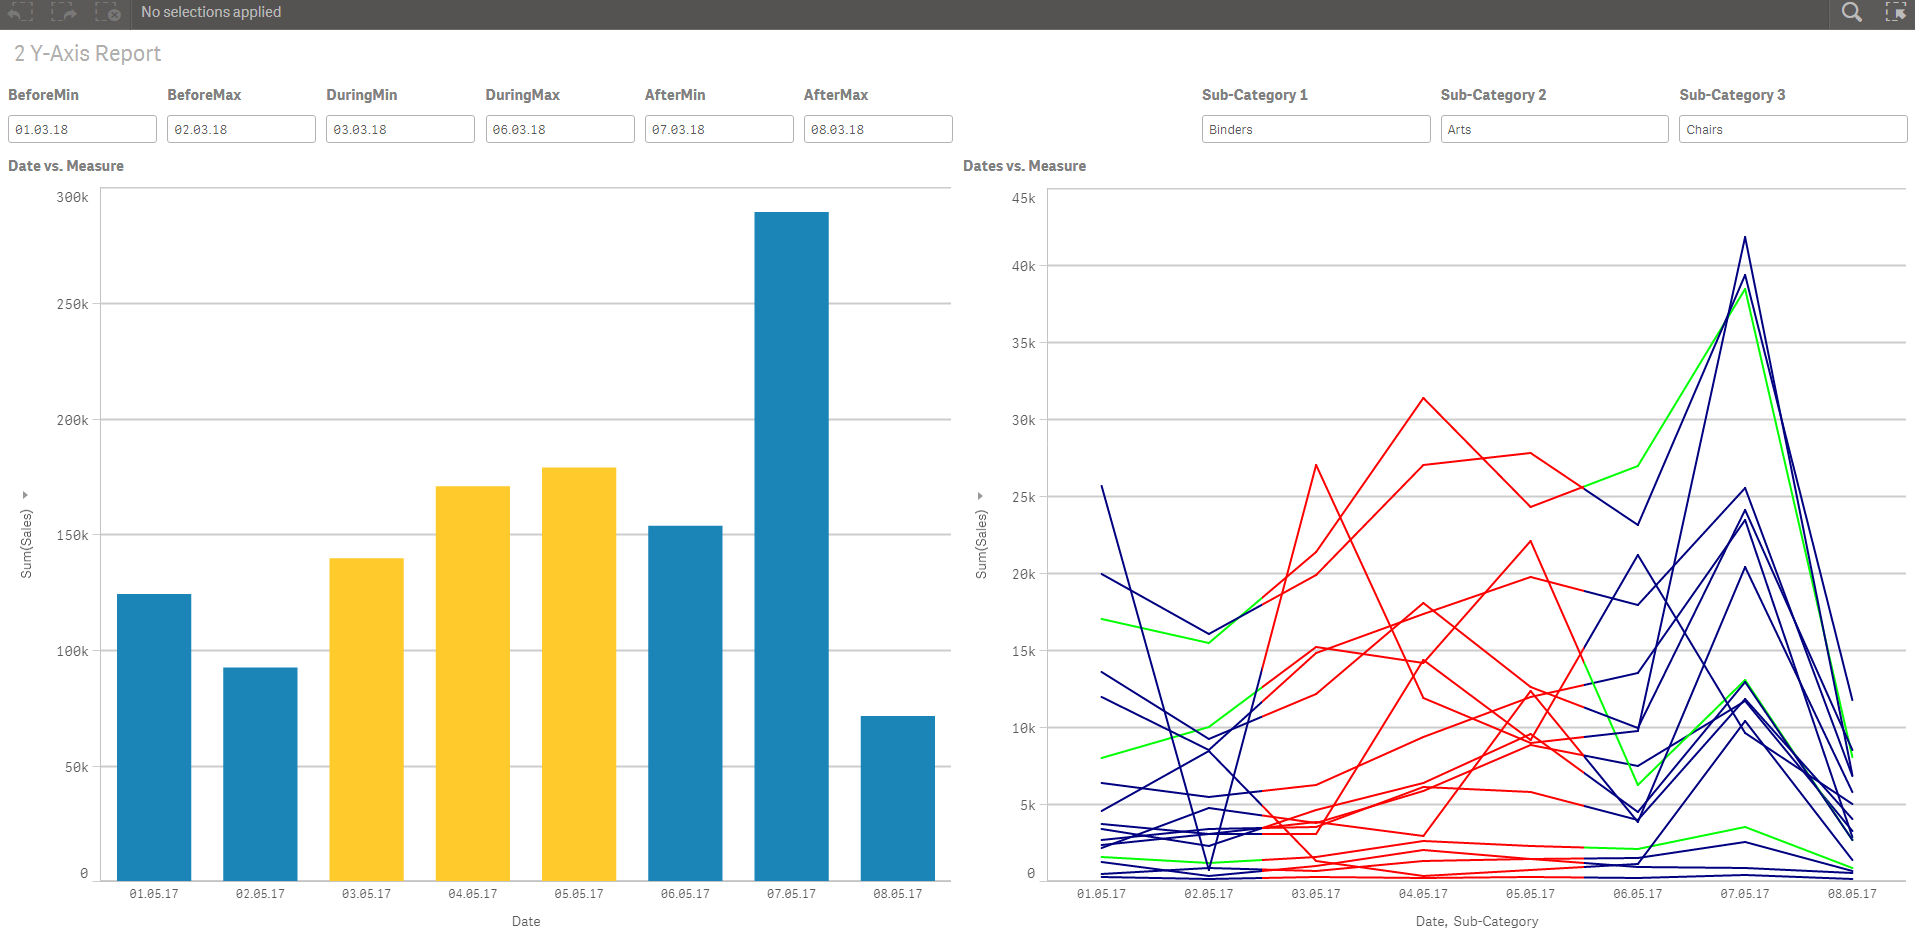
My question is: Is it possible to have a tab in the Y-axis of the combo and line charts in Qlik Sense to specify, in a fast way, another metric for the graphic (i.e. "Profit" or "Quantity") while conserving the same X-axis dimension ("Date")? Thanks in advance, Anibal
Values to write in the boxes to reproduce my Qlik Sense example (QS app attached):
BeforeMin = 01.03.18
BeforeMax = 03.03.18
DuringMin = 03.03.18
DuringMax = 06.03.18
AfterMin = 07.03.18
AfterMax = 08.03.18
Sub-Category 1 = Binders
Sub-Category 2 = Arts
Sub-Category 3 = Chairs
- Mark as New
- Bookmark
- Subscribe
- Mute
- Subscribe to RSS Feed
- Permalink
- Report Inappropriate Content
Hey Anibal
Can you tag this post to QlikSense Design Forum to get the help .
Thanks
CY
- Mark as New
- Bookmark
- Subscribe
- Mute
- Subscribe to RSS Feed
- Permalink
- Report Inappropriate Content
Done Chaitanya. Thanks for your help.