- Mark as New
- Bookmark
- Subscribe
- Mute
- Subscribe to RSS Feed
- Permalink
- Report Inappropriate Content
Table Creation
Hi all,
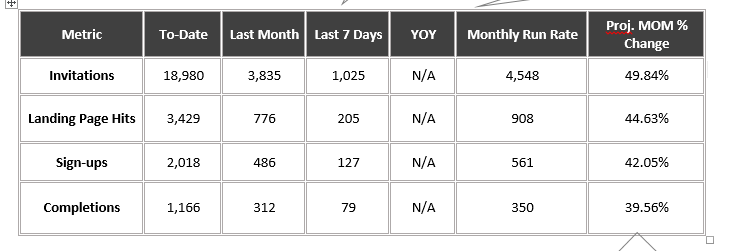
I need to create a table like below. i have attached the sample .qvf file
The metric column is not a dimension or measure. I need to enter the name is it possible ? if possible how can i do it?
Column To-date : needs the count of invitations, landing page hits, sign-ups, completions from our program start date.
My question is how can i add different dimension, measures for each row and column?
Need to add different measures for each column. is this possible in pivot table?

Expression to get the above count:
For To-Date column:
1. Invitations : Count({$<DateType = {invitation}>}invitation_id)
2. Landing Page Hits: sum({$<DateType = {accessed}>}landing_page_accessed)
3. Sign-Ups : sum({$<DateType = {signed}>}user_signed)
4. Completions : sum({$<DateType = {completion}>}course_completed)
For Last Month column:
1. Invitations : count({$<MonthsAgo={">=1<max(MonthsAgo)"}, DateType= {'invitation'}>} invitation_id)
2. Landing Page Hits: sum({$<MonthsAgo={">=1<max(MonthsAgo)"}, DateType= {'accessed'}>} landing_page_accessed)
3. Sign-Ups : sum({$<MonthsAgo={">=1<max(MonthsAgo)"}, DateType= {'signed'}>} user_signed)
4. Completions : sum({$<MonthsAgo={">=1<max(MonthsAgo)"}, DateType= {'completion'}>} course_completed)
As i need to use many measures.
Please help on table creation. I have no idea of creation of table with these many measures.
It's not mandatory to use pivot table just i need the table as above. The .qvf file contains the sample data.
Regards,
Pramod
- Tags:
- pivot table
- table
- « Previous Replies
-
- 1
- 2
- Next Replies »
Accepted Solutions
- Mark as New
- Bookmark
- Subscribe
- Mute
- Subscribe to RSS Feed
- Permalink
- Report Inappropriate Content
Hi,
Modify your script like this with Link table, then it is user to achieve this
SignUp:
LOAD invitation_id,
user_signed,
date_signed,
date_accessed,
landing_page_accessed
FROM
(txt, codepage is 1252, embedded labels, delimiter is ',', msq);
CourseCompletion:
LOAD course_completion_id,
invitation_id,
lender_offer_id,
final_test_status,
percentage_score,
course_completed
FROM
(txt, codepage is 1252, embedded labels, delimiter is ',', msq);
Invitation:
LOAD invitation_id,
client_id,
batch_meta_data_id,
activated,
date_activated
FROM
(txt, codepage is 1252, embedded labels, delimiter is ',', msq);
LinkTable:
LOAD DISTINCT invitation_id,
'Landing Page Hits' AS DataType
RESIDENT SignUp;
Concatenate(LinkTable)
LOAD DISTINCT invitation_id,
'Completions' AS DataType
RESIDENT CourseCompletion;
Concatenate(LinkTable)
LOAD DISTINCT invitation_id,
'Invitationa' AS DataType
RESIDENT Invitation;
Concatenate(LinkTable)
LOAD DISTINCT invitation_id,
'SignUps' AS DataType
RESIDENT SignUp;
- Mark as New
- Bookmark
- Subscribe
- Mute
- Subscribe to RSS Feed
- Permalink
- Report Inappropriate Content
Do an inline like below and have a dimension added to your module and it will become a part of your dimension;
Test:
LOAD * Inline [
Metric,
Invitation,
Landing Page Hits
Sign-ups
Completion];
Regards,
Imran K
- Mark as New
- Bookmark
- Subscribe
- Mute
- Subscribe to RSS Feed
- Permalink
- Report Inappropriate Content
small clarification the Test: should be the available table or we can have new one
- Mark as New
- Bookmark
- Subscribe
- Mute
- Subscribe to RSS Feed
- Permalink
- Report Inappropriate Content
Thanks for the reply,
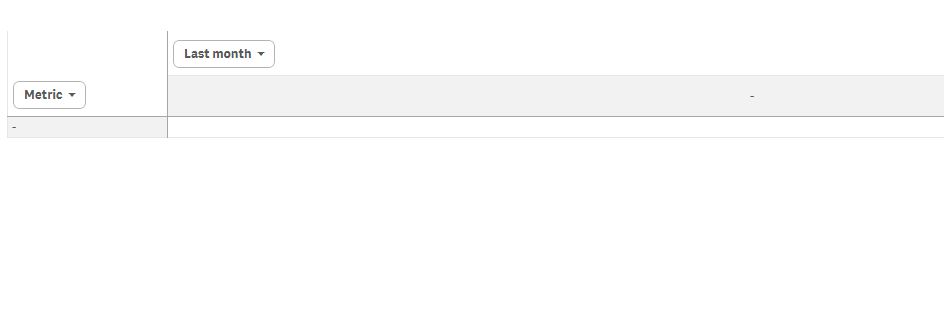
If i load above script it will not display in column.
please see the image
- Mark as New
- Bookmark
- Subscribe
- Mute
- Subscribe to RSS Feed
- Permalink
- Report Inappropriate Content
Can you please post a sample document?
I have guided you to add dummy dimension and rest you can write in the expression.
Imran K
- Mark as New
- Bookmark
- Subscribe
- Mute
- Subscribe to RSS Feed
- Permalink
- Report Inappropriate Content
- Mark as New
- Bookmark
- Subscribe
- Mute
- Subscribe to RSS Feed
- Permalink
- Report Inappropriate Content
Hi,
Can you post some of your sample records so that it would be easier to provide the solution. or you can try like below
LOAd
*,
Pick(Match(DateType, 'invitation', 'accessed', 'signed', 'completion'), 'Invitations', 'Landing Page Hits', 'Sign-Ups', 'Completions') AS NewField
FROM DataSource;
Now use NewField as dimension in your chart. Hope this helps you.
Regards,
Jagan.
- Mark as New
- Bookmark
- Subscribe
- Mute
- Subscribe to RSS Feed
- Permalink
- Report Inappropriate Content
Hi jagan,
You can find the sample .qvf and i am attaching .csv files also.
Ok i got dimension but how can i use many expressions or measures?
- Mark as New
- Bookmark
- Subscribe
- Mute
- Subscribe to RSS Feed
- Permalink
- Report Inappropriate Content
Hi,
Modify your script like this with Link table, then it is user to achieve this
SignUp:
LOAD invitation_id,
user_signed,
date_signed,
date_accessed,
landing_page_accessed
FROM
(txt, codepage is 1252, embedded labels, delimiter is ',', msq);
CourseCompletion:
LOAD course_completion_id,
invitation_id,
lender_offer_id,
final_test_status,
percentage_score,
course_completed
FROM
(txt, codepage is 1252, embedded labels, delimiter is ',', msq);
Invitation:
LOAD invitation_id,
client_id,
batch_meta_data_id,
activated,
date_activated
FROM
(txt, codepage is 1252, embedded labels, delimiter is ',', msq);
LinkTable:
LOAD DISTINCT invitation_id,
'Landing Page Hits' AS DataType
RESIDENT SignUp;
Concatenate(LinkTable)
LOAD DISTINCT invitation_id,
'Completions' AS DataType
RESIDENT CourseCompletion;
Concatenate(LinkTable)
LOAD DISTINCT invitation_id,
'Invitationa' AS DataType
RESIDENT Invitation;
Concatenate(LinkTable)
LOAD DISTINCT invitation_id,
'SignUps' AS DataType
RESIDENT SignUp;
- Mark as New
- Bookmark
- Subscribe
- Mute
- Subscribe to RSS Feed
- Permalink
- Report Inappropriate Content
Thanks a lot for the reply Jagan,
How to create a PIVOT table in standard Qlik Sense
I used this discussion and above your load script
LOAd
*,
Pick(Match(DateType, 'invitation', 'accessed', 'signed', 'completion'), 'Invitations', 'Landing Page Hits', 'Sign-Ups', 'Completions') AS NewField
FROM DataSource;
So now i am able to get the table
Can you help to get the last month, comparison of two months and two years,
you can see in the above image attached two columns YOY(year over year ) and Munthly Run Rate
- « Previous Replies
-
- 1
- 2
- Next Replies »