Unlock a world of possibilities! Login now and discover the exclusive benefits awaiting you.
- Qlik Community
- :
- Forums
- :
- Analytics
- :
- New to Qlik Analytics
- :
- Use function parameter in front end
- Subscribe to RSS Feed
- Mark Topic as New
- Mark Topic as Read
- Float this Topic for Current User
- Bookmark
- Subscribe
- Mute
- Printer Friendly Page
- Mark as New
- Bookmark
- Subscribe
- Mute
- Subscribe to RSS Feed
- Permalink
- Report Inappropriate Content
Use function parameter in front end
Hello All,
I have a function with parameter and I want user to select parameter in front to have visibility in dashboard accordingly based on passed parameter.
Function I called in Qlik Script
SELECT *
FROM [dbo].[Get_ Data](2021)
By using this function I am getting a table in Qlik front end but when I have to see the data of 2020 I had to go back to load editor and pass the parameter in function like
SELECT *
FROM [dbo].[Get_ Data](2020)
I just want my user can pass the year based on their requirement in front end and visualize the data because they can't go to load script.
Please advise.
Thanks
Accepted Solutions
- Mark as New
- Bookmark
- Subscribe
- Mute
- Subscribe to RSS Feed
- Permalink
- Report Inappropriate Content
If my understanding is correct, you have a dataset with data for various years and you want to retrieve data for specific year based on user's selection. In this case I would recommend the combination of variables and set analysis, but you have to load all the data for all the years. This will also ensure that your reload script is not executed all the time to retrieve different parts of the dataset. Those are the steps that I have followed:
- Load all the data for all the years
- Go to your sheets and click on Edit sheet
- Click on the Variables button, which is found on the bottom left corner

- Click "Create new" specify: "Name: vYearSelection" and "Definition: 2020" (This will be the default selected parameter)
- Now save it and go to your sheet
- Go to "Custom objects > About Qlik Dashboard bundle" and drug the "Variable input" object to the sheet
- From the properties go to "Appearance > Variable"
- Under the Name select "vYearSelection" and under the Show as select "Slider"
- The from "Appearance > Variable"
- Select Under Min the minimum year "e.g. 2016", under Max the maximum year "e.g. 2021" and enable "Slider label"
Then whenever you create a Chart, you will have to use a set analysis that will take into consideration the variable that we have created. For example an KPI's expression will look something like this: =Count({$<[OrderDate.autoCalendar.Year]={$(vYearSelection)}>} FIELD) where:
- Count() is the function that will count all the records in the FIELD
- [OrderDate.autoCalendar.Year] is the Year of the field OrderDate (This is example from my dataset, in your case your data might be different)
- $(vYearSelection) is the variable that we have defined earlier
- So this means that the count will be only performed on records where Year of OrderDate equals to the value stored in the variable
- When the slider is going to move, then the variable will change and thus the expression will calculate the new count based on the selected parameter.
Here is how my example looks like:
My Data:
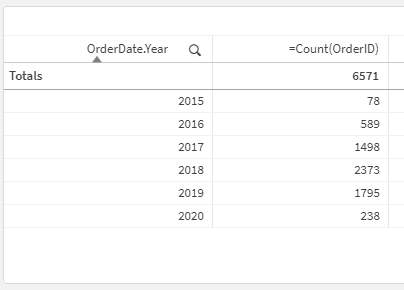
KPI for selected date 2018:
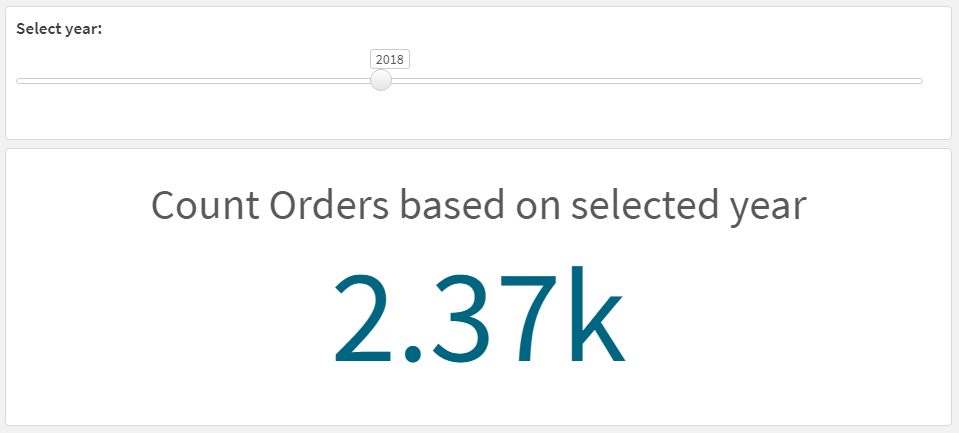 As you can see from the dataset the Order count was 2,373 for 2018 so the KPI shows 2.37K
KPI for selected date 2020:

As you can see from the dataset the Order count was 238 for 2020 so the KPI shows 238
I hope that this information was helpful
- Mark as New
- Bookmark
- Subscribe
- Mute
- Subscribe to RSS Feed
- Permalink
- Report Inappropriate Content
If my understanding is correct, you have a dataset with data for various years and you want to retrieve data for specific year based on user's selection. In this case I would recommend the combination of variables and set analysis, but you have to load all the data for all the years. This will also ensure that your reload script is not executed all the time to retrieve different parts of the dataset. Those are the steps that I have followed:
- Load all the data for all the years
- Go to your sheets and click on Edit sheet
- Click on the Variables button, which is found on the bottom left corner
- Click "Create new" specify: "Name: vYearSelection" and "Definition: 2020" (This will be the default selected parameter)
- Now save it and go to your sheet
- Go to "Custom objects > About Qlik Dashboard bundle" and drug the "Variable input" object to the sheet
- From the properties go to "Appearance > Variable"
- Under the Name select "vYearSelection" and under the Show as select "Slider"
- The from "Appearance > Variable"
- Select Under Min the minimum year "e.g. 2016", under Max the maximum year "e.g. 2021" and enable "Slider label"
Then whenever you create a Chart, you will have to use a set analysis that will take into consideration the variable that we have created. For example an KPI's expression will look something like this: =Count({$<[OrderDate.autoCalendar.Year]={$(vYearSelection)}>} FIELD) where:
- Count() is the function that will count all the records in the FIELD
- [OrderDate.autoCalendar.Year] is the Year of the field OrderDate (This is example from my dataset, in your case your data might be different)
- $(vYearSelection) is the variable that we have defined earlier
- So this means that the count will be only performed on records where Year of OrderDate equals to the value stored in the variable
- When the slider is going to move, then the variable will change and thus the expression will calculate the new count based on the selected parameter.
Here is how my example looks like:
My Data:
KPI for selected date 2018:
As you can see from the dataset the Order count was 2,373 for 2018 so the KPI shows 2.37K
KPI for selected date 2020:
As you can see from the dataset the Order count was 238 for 2020 so the KPI shows 238
I hope that this information was helpful