Unlock a world of possibilities! Login now and discover the exclusive benefits awaiting you.
- Qlik Community
- :
- Forums
- :
- Analytics
- :
- New to Qlik Analytics
- :
- Using multiple set modifiers in a set expression
- Subscribe to RSS Feed
- Mark Topic as New
- Mark Topic as Read
- Float this Topic for Current User
- Bookmark
- Subscribe
- Mute
- Printer Friendly Page
- Mark as New
- Bookmark
- Subscribe
- Mute
- Subscribe to RSS Feed
- Permalink
- Report Inappropriate Content
Using multiple set modifiers in a set expression
Hi community,
I have a viz with:
dimension: year
measure: sales broken down by product type (the colors represent different product types)
Chart 1:
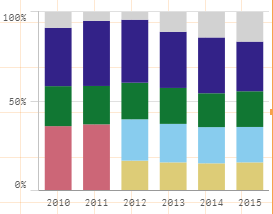
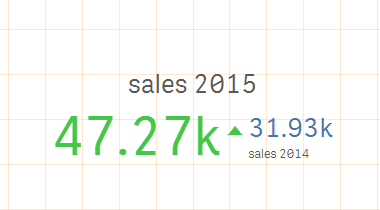
below that i have a KPI viz that tells me sales for 2015 & 2014
Chart 2:
How do i create a set modifier for 2014 and 2015 sales in the KPI chart(Chart 2) such that only a product segment selection from chart 1 above affects it but not the year selection..
The year should be fixed at 2014 and 2015 in Chart 2, but if I select the blue segment from anywhere in Chart 1 it should give sales for blue segment in 2014 and 2015 in Chart 2
- « Previous Replies
-
- 1
- 2
- Next Replies »
- Mark as New
- Bookmark
- Subscribe
- Mute
- Subscribe to RSS Feed
- Permalink
- Report Inappropriate Content
This would be easier to answer when you actually post your current epxressions.
You should be able to use set modifiers like
=Sum({<Year = {'$(=Max({1} Year))'}>} Sales)
resp.
=Sum({<Year = {'$(=Max({1} Year)-1)'}>} Sales)
- Mark as New
- Bookmark
- Subscribe
- Mute
- Subscribe to RSS Feed
- Permalink
- Report Inappropriate Content
Something like this for the green text:
SUM({1<[Product Type]=P()>}IF([Year]='2015',[Sales]))
And like this for the blue text:
SUM({1<[Product Type]=P()>}IF([Year]='2014',[Sales]))
This should ignore all selections except those in the [Product Type] field. Then, the if statement controls what year the SUM is calculating. There is probably a way to implement the Year into the set analysis, too.
- Mark as New
- Bookmark
- Subscribe
- Mute
- Subscribe to RSS Feed
- Permalink
- Report Inappropriate Content
Hi,
This exp does not use product type. Is that taken care of?
Why I ask is I am fairly new.
Its been a week since I have started on with Qlik and I do not have a set expression already in place.
- Mark as New
- Bookmark
- Subscribe
- Mute
- Subscribe to RSS Feed
- Permalink
- Report Inappropriate Content
Hi This expression changes back my sales to 0.
I am definitely doing something wrong here. What does the P() function do here?
I am sorry but I am really new to the Qlik product.
Thanks in advance.
- Mark as New
- Bookmark
- Subscribe
- Mute
- Subscribe to RSS Feed
- Permalink
- Report Inappropriate Content
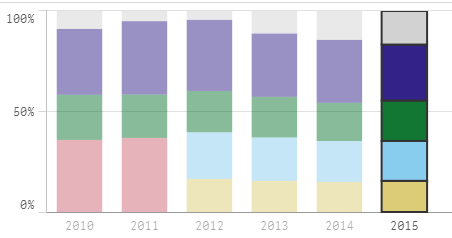
Edit to question above:
Also on a related note in chart 1, Could someone kindly tell me how to make selection in a stacked bar chart on a specific product type, without selecting the entire year(like the pic below). I don seem to be able to do that without filtering on a year?
- Mark as New
- Bookmark
- Subscribe
- Mute
- Subscribe to RSS Feed
- Permalink
- Report Inappropriate Content
Have you created an expression per product type or have you used a second dimension product type to group by your single expression? As I said, it's much easier to answer these kind of questions if we get the full picture.
If possible, create a small sample QVF and upload it to this thread.
- Mark as New
- Bookmark
- Subscribe
- Mute
- Subscribe to RSS Feed
- Permalink
- Report Inappropriate Content
Here, you must click one to limit the selections to the selected year. Once the bar chart is only showing one bar, you can then select the product type by clicking on an individual segment. You can then deselect the year in the grey ribbon at the top of the sheet.
It might be better to have a list box rather than rely on clicking the segment in your chart to limit the scope to a specific product type.
- Mark as New
- Bookmark
- Subscribe
- Mute
- Subscribe to RSS Feed
- Permalink
- Report Inappropriate Content
In this context, where P() is empty, it is simply representing all of the possible selections or selections made in the [Product Type] field.
The formula I wrote should be saying: "Ignoring everything except the Product Type field, take the sum of Sales where the year is ... "
- Mark as New
- Bookmark
- Subscribe
- Mute
- Subscribe to RSS Feed
- Permalink
- Report Inappropriate Content
Hi,
Uploading a QVF might not be feasible. I will try my best to explain:
Chart 1:
I have created a expression as below for measures:
sum(Sales) / sum( TOTAL <Year> Sales) to get a 100% stacked bar
The dimensions include
[Product type] and [year]
Chart 2
simple set expressions for both the years:
sum({$<Year={2014}>}sales)
sum({$<Year={2015}>}sales)
Hope this helps. If it is still not understandable I will post a qvf Thanks.
- « Previous Replies
-
- 1
- 2
- Next Replies »