Unlock a world of possibilities! Login now and discover the exclusive benefits awaiting you.
- Qlik Community
- :
- Forums
- :
- Analytics
- :
- New to Qlik Analytics
- :
- VARIABLE ROLLING CALENDAR
- Subscribe to RSS Feed
- Mark Topic as New
- Mark Topic as Read
- Float this Topic for Current User
- Bookmark
- Subscribe
- Mute
- Printer Friendly Page
- Mark as New
- Bookmark
- Subscribe
- Mute
- Subscribe to RSS Feed
- Permalink
- Report Inappropriate Content
VARIABLE ROLLING CALENDAR
Hi
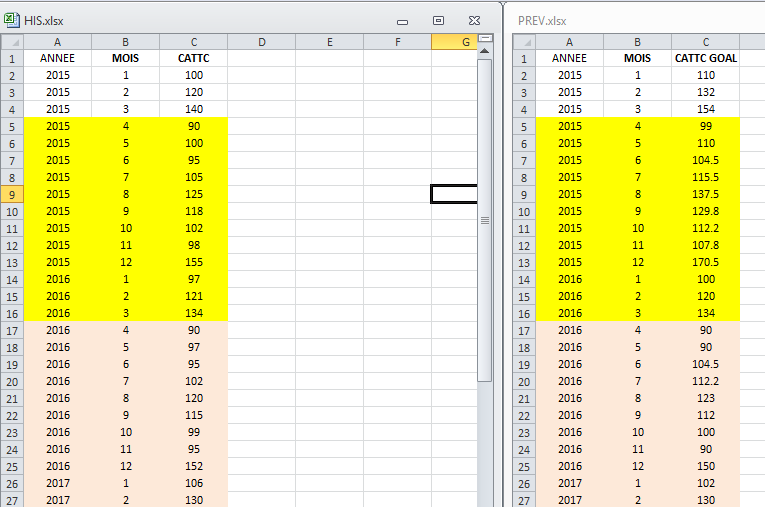
To explain my issue i created a simple sample ;
I have 2 files with common dates (3 years ) as shown
As you see in highlighted cells, i have to take care of a fiscal calendar beginning on April and ending on March
So i need a rolling calendar in my qlik sense’s app.
I saw several threads about this BUT …
what i need exactly is to create a variable selector in my visualisation so a simple user can change the beginning and end of the rolling year (always 12 month anyway) as he please...
2 goals for the user :
- be able to change between usual year and fiscal year to compare with others users as well
- when i'll duplicate and send my app to a new user, he can easily change the fiscal year without needed me
Anyone to help me ?
PS: i already created autocalendar and i wrote in a previous thread about calendar measure and comparaison between YEAR and Last YEAR
Regards
Philippe
- Mark as New
- Bookmark
- Subscribe
- Mute
- Subscribe to RSS Feed
- Permalink
- Report Inappropriate Content
Really having trouble figuring out what you are trying to do and what is the final output needed
- Mark as New
- Bookmark
- Subscribe
- Mute
- Subscribe to RSS Feed
- Permalink
- Report Inappropriate Content
Try with slider object: flag the multiple value option and fix step to 12 (month). You select automatically the range, the user can move the slider and so change the beginning of the period.
- Mark as New
- Bookmark
- Subscribe
- Mute
- Subscribe to RSS Feed
- Permalink
- Report Inappropriate Content
Well, i trying again ...
Instead of selecting year 2016 (beginning January ending December) in the visualisation, i want to be able to select year 2016 f (f for fiscal) beggining April 2016 ending March 2017.
Of course a tricky script can do it i think (and i hope you tell me wich one ;-), but also, i hope a solution that allows a simple user to choose the beginning and the and of the fiscal year.
For example, i create an app for user 1 who have a fiscal year APRIL to MARCH.
ok, i duplicate the app and send it to user 2 who have a fiscal year JUNE to MAY.
so i want the user 2 to be able to change the Beginning and the End of his Year without editing a script (if possible in acting in field in the visualisation ?)
hope it's let you unterstand ?
regards
Philippe
- Mark as New
- Bookmark
- Subscribe
- Mute
- Subscribe to RSS Feed
- Permalink
- Report Inappropriate Content
Thank's Edmondo.
if i unterstood yu, i already did that
if it's only to move in a graph it's ok...
but here i need to create a new year entity (fiscal YEAR) to be able to create all sort of analysis between 2 fiscal years ; for example comparative MARGIN in € and % between fiscal YEAR N-1 Vs N Vs GOAL ...
However if i can do that with a slider object , i take ...
regards