Unlock a world of possibilities! Login now and discover the exclusive benefits awaiting you.
- Qlik Community
- :
- Forums
- :
- Analytics
- :
- New to Qlik Analytics
- :
- YoY Difference and Growth
- Subscribe to RSS Feed
- Mark Topic as New
- Mark Topic as Read
- Float this Topic for Current User
- Bookmark
- Subscribe
- Mute
- Printer Friendly Page
- Mark as New
- Bookmark
- Subscribe
- Mute
- Subscribe to RSS Feed
- Permalink
- Report Inappropriate Content
YoY Difference and Growth
Hello everyone,
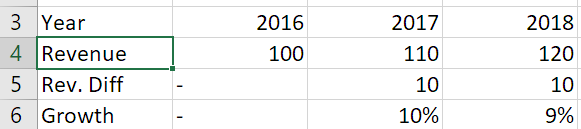
I'm looking for a method to visualize the YoY difference and growth in a pivot table.
For example:
I tried this formula:
Sum( { $< [DocumentYear]={$(=max(DocumentYear))}>} Revenue)
- Sum( { $< [DocumentYear]={$(=max(DocumentYear)-1)}>} Revenue)
But I don't get what I want:
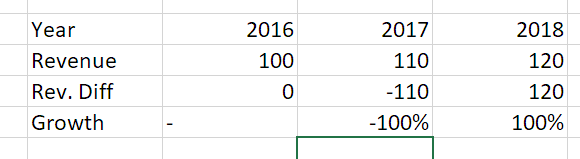
I think the problem is, that the pivot table filters the data for the years.
Do you know a method for this problem?
Thank you in advance!
Accepted Solutions
- Mark as New
- Bookmark
- Subscribe
- Mute
- Subscribe to RSS Feed
- Permalink
- Report Inappropriate Content
Hey Ishtdeep Singh,
thank you for your answer.
I already have found a solution for my problem. I used 'Before()'.
Sum( { $< [DocumentYear]={$(=max(DocumentYear))}>} Revenue)
- Before(Sum( { $< [DocumentYear]={$(=max(DocumentYear))}>} Revenue))
- Mark as New
- Bookmark
- Subscribe
- Mute
- Subscribe to RSS Feed
- Permalink
- Report Inappropriate Content
Please share your data in excel sheet or sample application.
Thank you!
- Mark as New
- Bookmark
- Subscribe
- Mute
- Subscribe to RSS Feed
- Permalink
- Report Inappropriate Content
Hey Ishtdeep Singh,
thank you for your answer.
I already have found a solution for my problem. I used 'Before()'.
Sum( { $< [DocumentYear]={$(=max(DocumentYear))}>} Revenue)
- Before(Sum( { $< [DocumentYear]={$(=max(DocumentYear))}>} Revenue))