Unlock a world of possibilities! Login now and discover the exclusive benefits awaiting you.
Announcements
Join us at Qlik Connect for 3 magical days of learning, networking,and inspiration! REGISTER TODAY and save!
- Qlik Community
- :
- Forums
- :
- Analytics
- :
- New to Qlik Analytics
- :
- comparing daily sales between years
Options
- Subscribe to RSS Feed
- Mark Topic as New
- Mark Topic as Read
- Float this Topic for Current User
- Bookmark
- Subscribe
- Mute
- Printer Friendly Page
Turn on suggestions
Auto-suggest helps you quickly narrow down your search results by suggesting possible matches as you type.
Showing results for
Creator III
2017-01-31
11:57 AM
- Mark as New
- Bookmark
- Subscribe
- Mute
- Subscribe to RSS Feed
- Permalink
- Report Inappropriate Content
comparing daily sales between years
Hi,
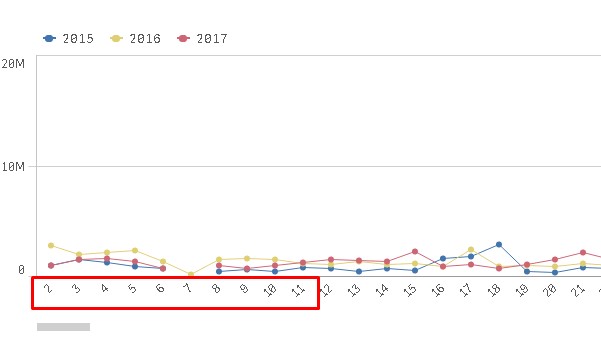
I am trying to put two dimensions on the line chart in order to compare daily sales for the chosen years:
1. Date(Date,'MM/DD') - custom dimension
2. Year
Unfortunately, it creates duplicated dimensions equal to the number of years I have and does not combine it (in my example i have three years horizon and it creates three 01/01 values, 02/01 values and so on)
PS: I am still able to make it when the dimension is "Day of the Year" (see the screenshot below), but is does not work for me - I need to see actual dates (DAY and MONTH) on the X-axis.

can you help me please
1,857 Views
- « Previous Replies
-
- 1
- 2
- Next Replies »
10 Replies
MVP
2017-02-03
08:09 AM
- Mark as New
- Bookmark
- Subscribe
- Mute
- Subscribe to RSS Feed
- Permalink
- Report Inappropriate Content
May be this:
Date(SetDateYear(Date, Year(Max(TOTAL Date))), 'MM/DD')
142 Views
- « Previous Replies
-
- 1
- 2
- Next Replies »
Community Browser